
Thalassiosira Pseudonana (thaps)
by Linnea Stavney and Ivan Esmeral
Everyone knows that plants provide the majority of the oxygen on Earth for us to breath. Right? Wrong. Although phytoplankton only make up 1% of the earth’s biomass, they produce half of the Earth’s oxygen.
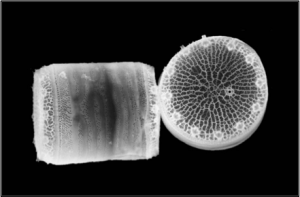
Thalassiosira pseudonana (thaps) is a relatively large diatom that resides all over in the world’s oceans. Phytoplankton, which includes diatoms, are a huge part of marine food chains, the carbon cycle, and the recycling of oxygen. Since they require carbon to survive, an increasingly CO2 rich atmosphere would potentially be very beneficial to them, but the ocean is such a complicated system that it is essential to learn more about how diatoms behave in order to accurately predict the effects of greenhouse gases and ocean acidification.
Experiment 1: Preferred Light Levels
Like all organisms in the natural world, diatoms need a very specific balance of environmental conditions in order to thrive. As an organism that uses photosynthesis, light is one of these requirements. Diatoms are like our eyes; deficiency of light limits productivity, just like darkness decreases visibility. In contrast, too much light causes photo-inhibition in diatoms, like looking at a blinding light, which prevents them from functioning properly. Finding this optimal light preference is essential to understanding thaps and protecting them from the effects of ocean acidification.
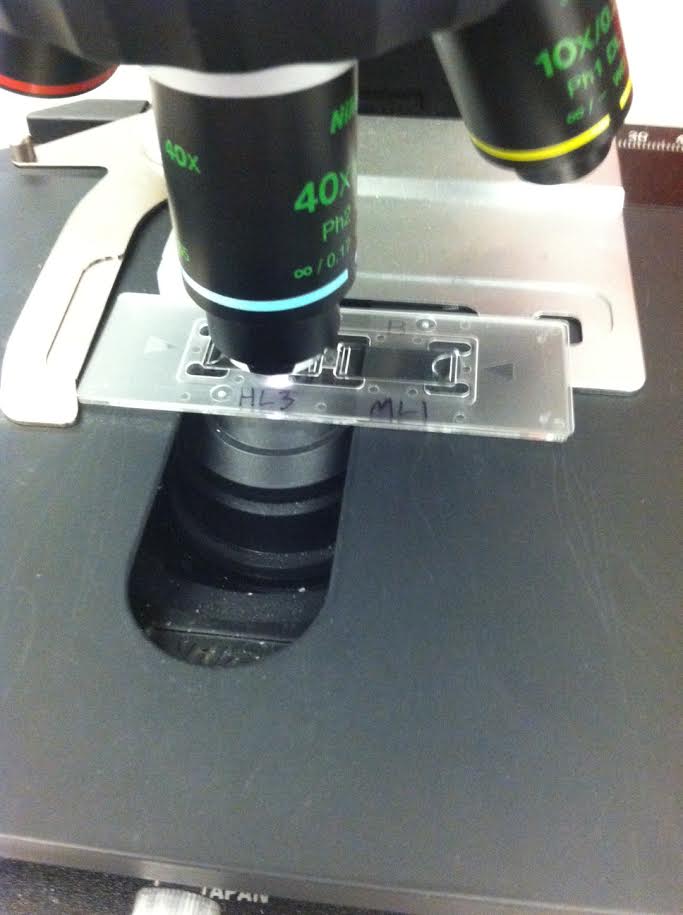
The medium, or growing solution, used for all of our thaps experiments was ESAW: “enhanced seawater, artificial Hemocytometer slidewater”. ESAW is a mixture of trace minerals, nutrients, salt and water, which provides the diatoms with an optimal environment to grow. In order to monitor the prosperity of the diatoms at different light levels, we mixed 20mL of media and 2mL of a pre-cultured thaps solution into 15 cell culture flasks. These were separated into five groups: high light (HL), medium light (ML), low light (LL), very low light (VL), and darkness (D), with three containers in each group. These were placed at various distances away from a light source in a culture room and monitored over the course of two weeks. In order to measure the population and health of the diatoms, we found their OD (optical density), the number of cells using a hemocytometer, and their QY (quantum yield), which measures the cell’s photo efficiency.
OD was measured by using an AquaPen, which shines light through the sample and senses the amount of light that penetrates through the sample. QY is measured using the same device; a laser is flashed onto the diatoms and the diatoms radiate back what they do not use for photosynthesis. The difference between the initial amount of light and that radiated back is measured, representing their ability to properly perform photosynthesis. The higher the QY, the healthier and more abundant the diatoms are.
As the graph demonstrates, thaps prefers VL. Although the OD (population) was about equal for VL and LL, VL had a consistently higher QY, which means that the cells were much healthier. The cells in D did not grow very much at all, but they had a much higher QY than those in HL because HL was receiving so much light that it had to radiate a lot of it back and probably became more resistant to light.
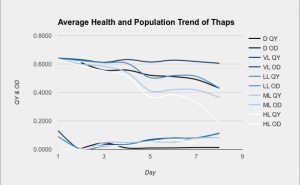
< Three measurements were taken from three containers in each light category. The technical and biological averages were found, and then combined into one comprehensive graph. The upper cluster of lines represents the QY, and the lower cluster represents the OD.
Experiment 2: Contamination Test
Plates were poured with the following:
Media: 500 mL
Agar: 1.8%, 9g/500mL
Glucose: 0.05%, 2.5g/500mL
Yeast: 0.05%, 25g/500mL
Autoclave –> 50ºC water bath
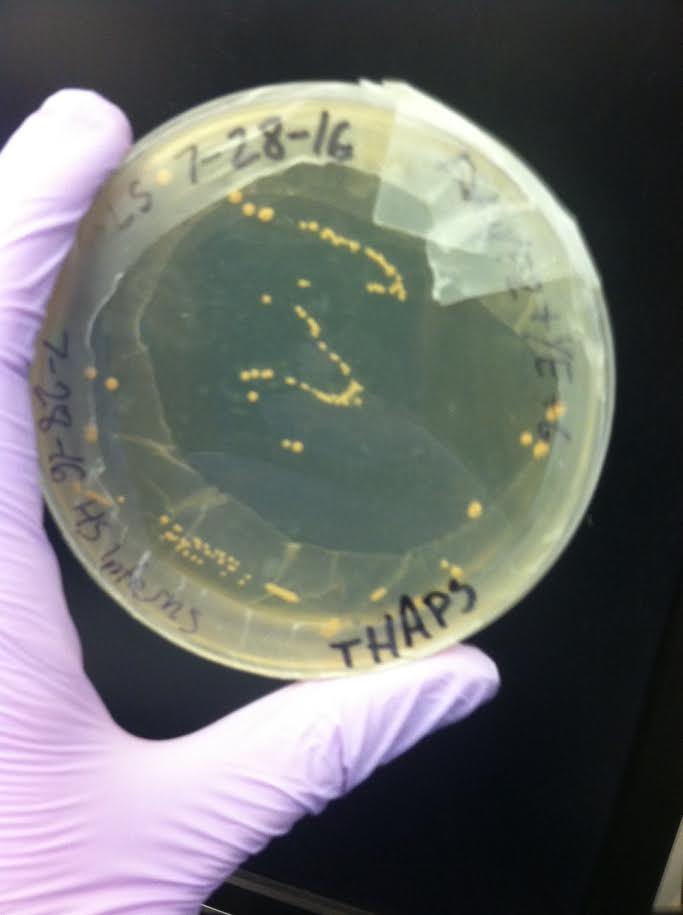
We then poured regular plates with media and agar to practice culturing thaps, using a laminar hood. The plates were stored in a fridge to grow. This experiment was used to test if our sample of diatoms was contaminated. The yeast and sugar provides a food source for bacteria, allowing any contaminants to quickly grow into visible colonies. After a few days, yellowish bacterial colonies were visible–our sample was contaminated.
In order to test the quality of our media and techniques, we made a positive control by streaking our finger across the plate,and a negative control by leaving one blank. If the positive control grows, the agar is sound, and if the negative control remains clean, the agar is sterile.
Purpose: Dilution to extinction is one method to decontaminate samples. To do so, a small amount of the bacteria-infested diatom culture is inserted into a tube of media, and then successively diluted into more and more test tubes until approximately one or two cells are isolated in the last few tubes. Antibiotics are then added, and the diatoms are given time to grow, hopefully out-competing the few bacteria that were in the last few tubes.
Method: In order to do this, we put 10mL of media into 20 test tubes, separated into two groups (Figure 6). The first test tube in each set had 2mL of diatoms, and then 10μL of the solution was transferred in succession from one tube to the next in order to dilute the diatoms. The first set had 10μL of ampicillin and kanamycin in every tube, and the second set had 20μL, to test the optimal concentration of antibiotics.
Conclusion: There was not enough time to culture the sterilized solutions, but after a few days there was visible growth of diatoms, especially in the highly concentrated tubes.
Update: As of September 20th, 2016, our mentor Jake Valenzuela confirmed that our isolation was successful, and he was able to use our pure culture for future experiments.
To see how we displayed this information for our final presentation, as well as our sources and acknowledgements, check out our Poster.