
Chlamydomonas reinhardtiii
by Christine D. Pham
Background
Chlamydomonas reinhardtii, or “Chlamy” for short is a unicellular, soil-dwelling, photosynthesizing, green algae flagellate. It is approximately 10um long and lives in various environments throughout the world. Similar to most model organisms, the genome for C. reinhardtii has been completely sequenced. The genome is relatively small compared to other organisms. C. reinhardtii can be easily manipulated, genetically and molecularly, making it an ideal model organism. It is a haploid organism with the capacity to grow with light as its sole energy source utilizing photoautotrophic growth and it can also feed on acetate to grow in the dark.
Experiment
As part of my internship at ISB, I teamed up with Jordan Raymond, an undergrad intern, to lay the groundwork for phytoplankton research. We set out to graphically determine the relationship between optical density and cell count C. reinhartii for use in future experiments.
Many experiments require an approximate cell count to understand relative cell growth or transfer procedures. Currently optical density is easy to measure at 680nm and 720nm with an aquapen. An aquapen works like a spectrometer, measuring the reflection or transmission of light at 680nm and 720nm. Optical density at 680nm measures the amount of chlorophyll and optical density at 720nm measures particulates. However, counting C. reinhartii cells require a more extensive protocol, including the use of formaldehyde and microscope, and is time consuming.
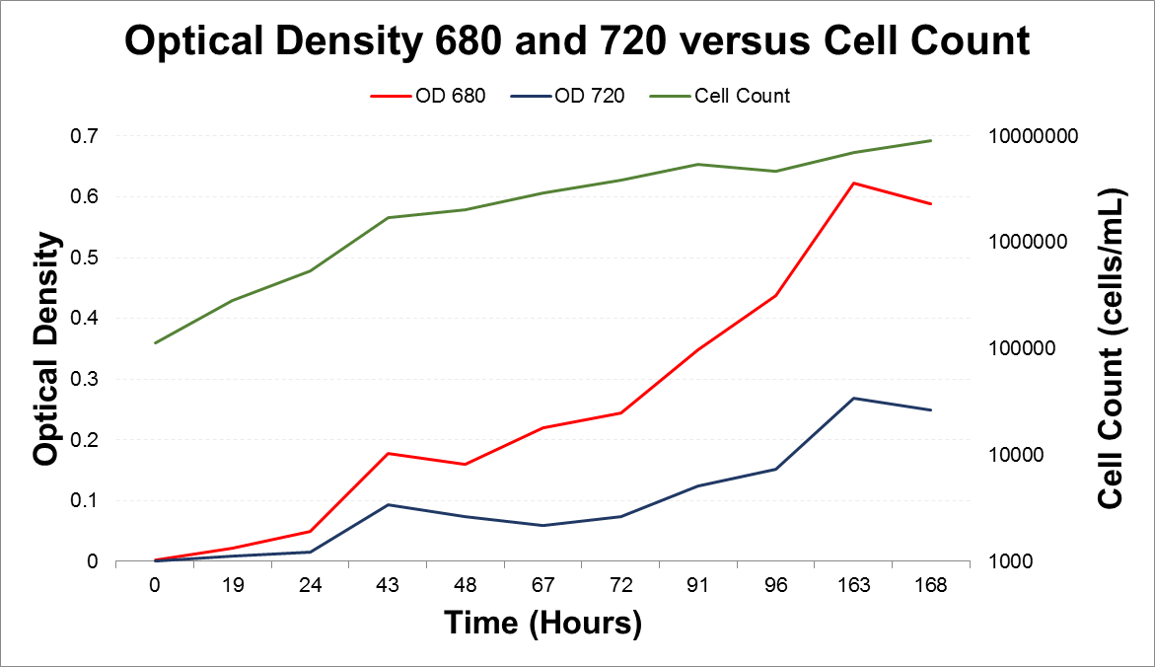
There is a strong correlation between optical density and cell count. When graphed against each other, a linear correlation (R^2) can be calculated. An R^2 value closer to 1 shows a stronger correlation.


There is a greater fit between optical density and cell count at earlier stages of growth, as the population gets into late log phase and into stationary then the correlation is less significant. As growth continues the use of OD to infer cell count or vice versa is less accurate.
Conclusion
In Chlamydomonas reinhartii there is a significant correlation between optical density and cell count, where one can be used to infer the other. This will prove to be useful in future experiments.