
Joaquin Orozco and Teoman Toprak worked on validating a causal mechanistic flow model of the biological pathways of Glioblastoma Multiforme. This is their presentation on the topic
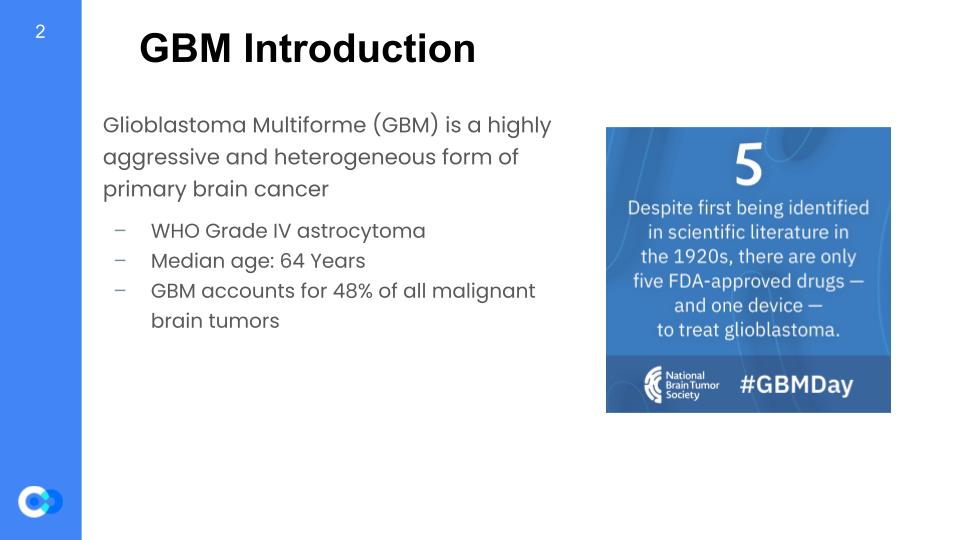
Glioblastoma Multiforme, or GBM, is a dangerous form of primary brain cancer mainly because they are aggressive and hard to remove. The World Health Organization (WHO) identifies GBM as a grade IV astrocytoma. It mainly targets the older population as the median age of diagnosis is around 64 years. Not only this, but it accounts for almost 48% of all malignant brain tumors, making it the most common malignant brain tumor. Despite it being around for a long time and being so common, there are only 5 FDA approved drugs and one device for GBM treatment since the 1920s because of its difficult-to-study nature.
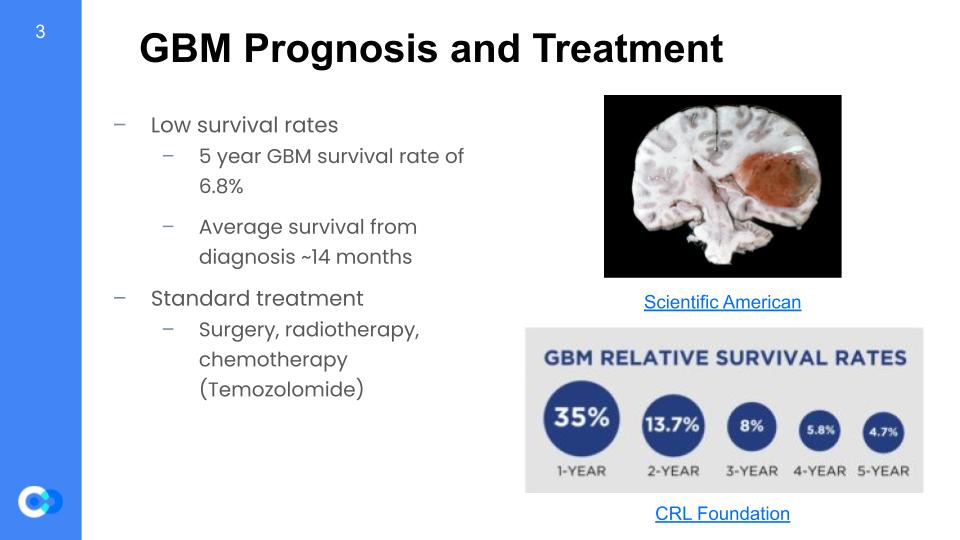
GBM is very difficult to diagnose and treat. Thus, its survival rates are extremely low at about 6.8% for 5 years. Especially for the older population which GBM mostly targets, the survival rates are a lot lower because survival rate decreases as the patient becomes older. Furthermore, the average survival from diagnosis is about 14 months which is not very long compared to other forms of cancer. Many of the most commonly diagnosed cancers have ten-year survival of 50% or more. Despite GBM being so dangerous, the methods for cancer treatment is still applicable to GBM including surgery, radiotherapy, and chemotherapy.
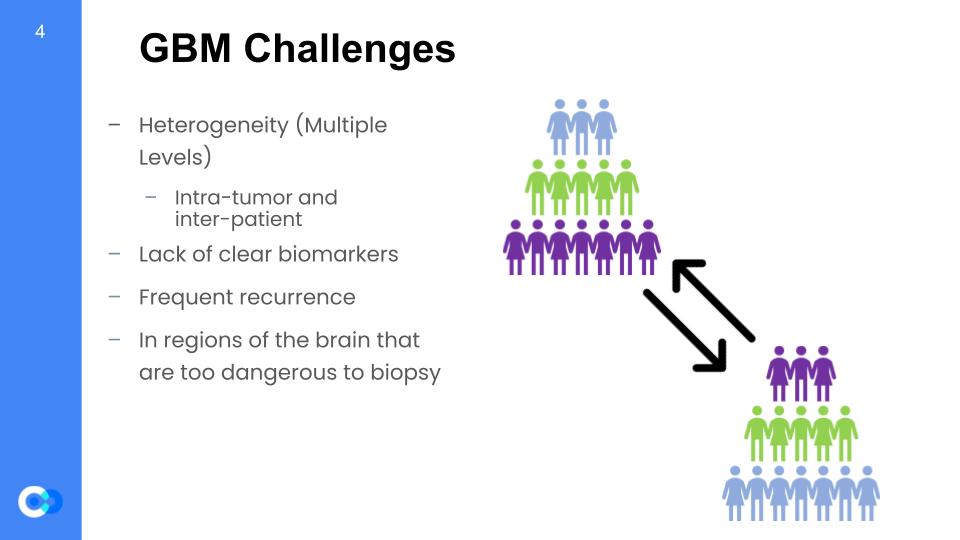
As glioblastoma multiforme is a troublesome form of primary brain cancer, there are challenges that come with it. First, it has heterogeneity which means each tumor can show distinctive features on a patient to patient basis and even in a given patient, there may be inter-tumor differences. There are multiple levels to heterogeneity. Next, there is a lack of clear biomarkers due to it not being studied enough. Frequent recurrence is also an issue which makes further treatment more difficult because the recurrence develops resilience. Finally, GBM situates in regions of the brain that are too dangerous to biopsy and study further.
Models are very helpful in explaining natural phenomena. More specifically, a validated network model is very useful for things like cancer – GBM in our case. These predictive models can help us create new approaches and therapies for cancer treatment by identifying causal and mechanistic events that underlie disease progression. Furthermore, the models can predict high and low risk regulons to determine more effective treatment strategies to counter GBM. Finally, personalized cancer therapy can eventually be developed through network mapping by matching certain treatments accordingly to a person by person basis. All in all, a validated network model for GBM is essential for developing newer treatments for this aggressive brain cancer.
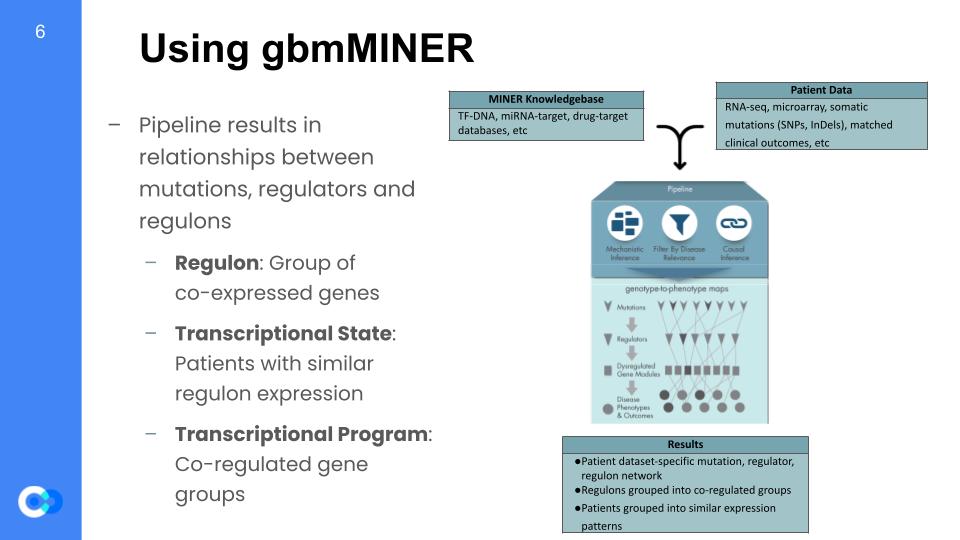
This network mapping was completed using the MINER algorithm. This MINER algorithm takes in a database of genes thought to be related to GBM, and it also takes in patient data, which consists of how long they survived after diagnosis (survival data), and also their expression data. Expression is the measure of how much one gene is being activated and producing their respective protein, so the full expression dataset is done by gathering the expression of multiple genes across many different patients. MINER takes all that in, and once it’s out the other side of the pipeline, it gives inferences on how each gene is activated (causal inferences) and what that gene affects (mechanistic inferences). Based off of those inferences, it filters for the genes that actually affects the life expectancy of patients. It then builds a digital model of the biological and biochemical pathways that affect different aspects of GBM.
The way it simplifies the given data is by grouping the data into larger generalizations. The first step is to generate regulons, which are groups of genes that are co-expressed, meaning they share the same “transcription factor”, or activation protein, thus get activated together. The data can then be split into 2 more groupings, which are transcriptional states and transcriptional programs. A transcriptional state is a group of patients that share the same gene expression, and a transcriptional programs are groups of regulons that share similar expression patterns.
Now, the original model building had already taken place when we arrived at ISB. It was our job to make sure the model was representative of the real world, and we did this by using other expression datasets generated by other, independent studies.
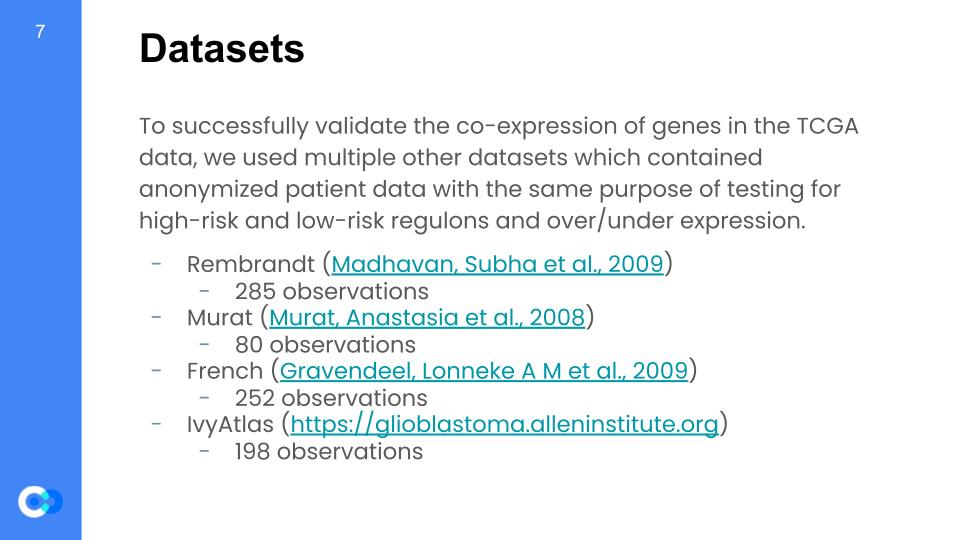
Initially, we had the TCGA data on-hand to complete the validation testing for the gbmMINER. However, we wanted the data to be coherent across multiple datasets to increase its reliability. As a result, we used the four extra datasets of Rembrandt, Murat (GSE7696), French, and IvyAtlas. Inside of their miner inputs, we are given gene expression data for each anonymized patient and can use this data to test for high-risk and low-risk regulons and whether they are over expressive or under. By doing this, we can validate our data by ensuring that the results are coherent.
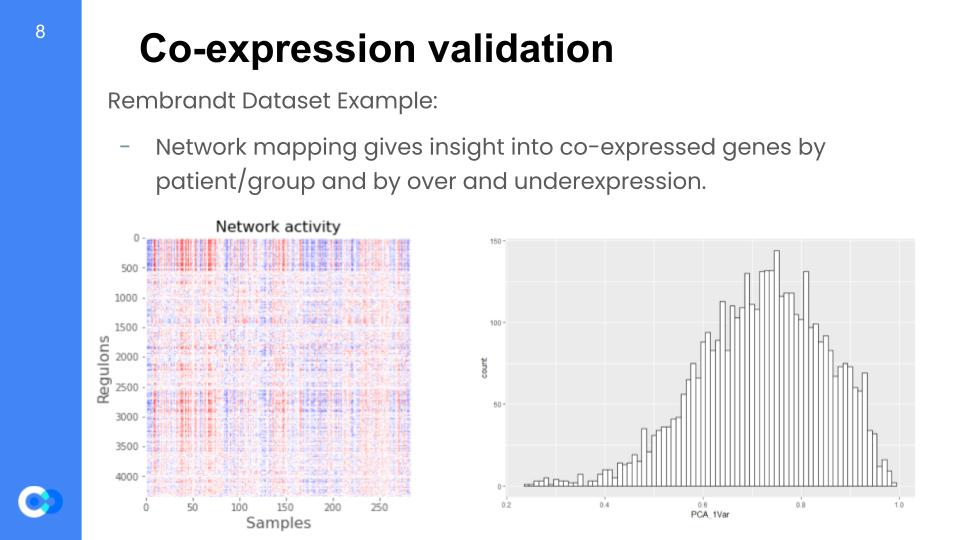
We are able to run network mapping and test for regulon expression by patient. We want to understand whether regulons are coherent when tested with these external datasets that were not used in the model training data and almost rebuild the model. In the network mapping, we produce the coherent members (variance explained by first principal component analysis or PCA) per dataset and later perform random permutations (simply put, changing the arrangement) of a gene set within a regulon and testing for coherence with the new dataset. For example, these two graphs were taken from the Rembrandt dataset and we can see the regulon expression per each patient (color key: red = overexpressed, blue = underexpressed). On the right, we see the distribution of variance that is given by the principal component analysis (PCA) for the regulon coherence.
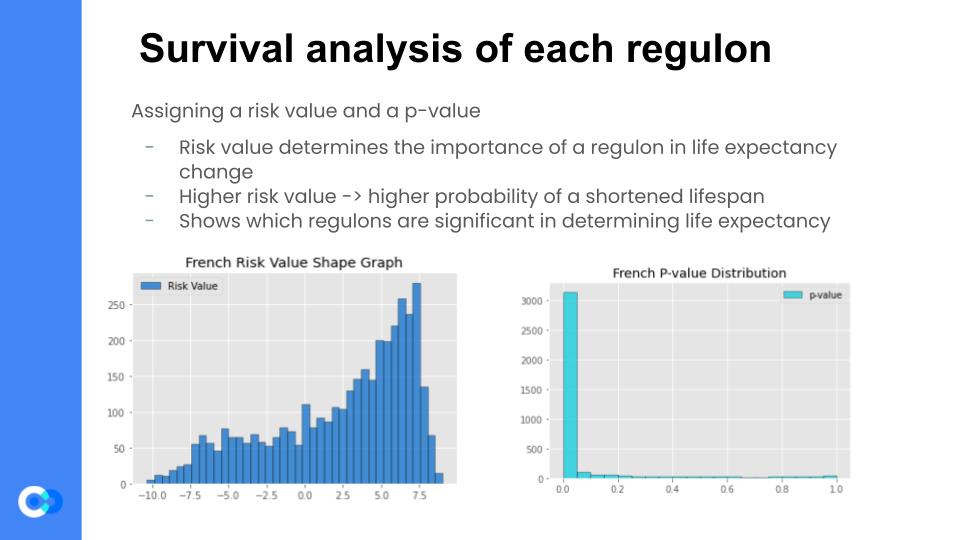
Now that we were confident that the regulons generated by the previous step were coherent, we then assigned a risk value to each regulon, using the Cox Proportional Hazards Analysis Regression. Fancy terminology aside, it essentially correlates the regulon’s expression levels with the patient survival data. It then generates a risk value for each regulon, which determines the “importance” of a regulon in determining life expectancy. For example, if a regulon has a high risk value, then that regulon’s expression level changes in a patient with GBM, then there is a heightened probability of a shortened lifespan of that patient. The Cox HR Analysis also assigns a p-value to each regulon, which is almost like a confidence value – the higher the p-value, the less confident the model is that the generated risk value is accurate.
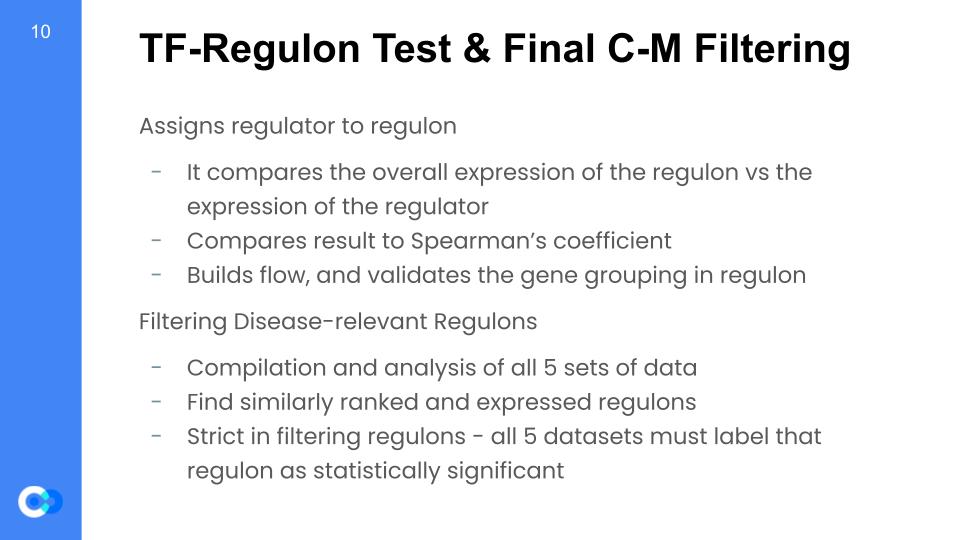
These are the last 2 steps, in which we finally compile all of the validation datasets. But first, we assign a regulator to each of the regulons. It does this by comparing the expression level of the regulator’s gene to the overall expression level of the regulon, and checks to see how they match. For example, if there is a regulator with a higher expression than normal, but the regulon doesn’t change, then it is likely that the regulator does not affect the regulon, so the script just picks a new one at random and checks it again. Once, that’s done running, it then compares that result to an independent analysis called the Spearman’s coefficient, and if the two analyses agree, then the regulator matches with the regulon. This step is done mainly to build a model of how the regulons get affected by their regulators, as any changes in their regulator’s expression can result in changes in the regulon’s expression, and thus changes in the patients lifespan, for example.
Then – finally – we can compile all of the datasets and look for the ones that are the highest risk in all of the datasets. We find similarly risk-valued and expressed regulons, and if all 5 datasets agree that this is a high risk regulon, then all 5 datasets must label that regulon as a statistically significant disease relevant regulon.
The causal mechanistic filtering is important because it essentially separates the disease relevant results (that are statistically significant) from the overall results and allows us to draw conclusions for just the filtered MINER results. Firstly, we use the TF-regulon statistical test for filtering results that have a PCA explained variance of >=0.3 and a random permutation p value of <=0.05 in both the training set (TCGA) and one of the 4 independent datasets. Only the ones with correlation and are significant are kept from the regulons. Next, we look at the Cox HR results for the kept regulons. Cox HR investigates the association between the survival time of patients and one or more predictor variables. We filter only the ones that had a Cox HR value of <= 0.05 for the training data and one of the 3 datasets that had survival data (Rembrandt, Murat, or French because IvyAtlas has no survival data). We also test for significance between the mutation-eigen gene and the mutation regulator t test. Finally, all this data is compiled into a single CSV file where there is only the disease relevant C-M flows that are significant from the C-M filtering along with the survival significance from the Cox HR.
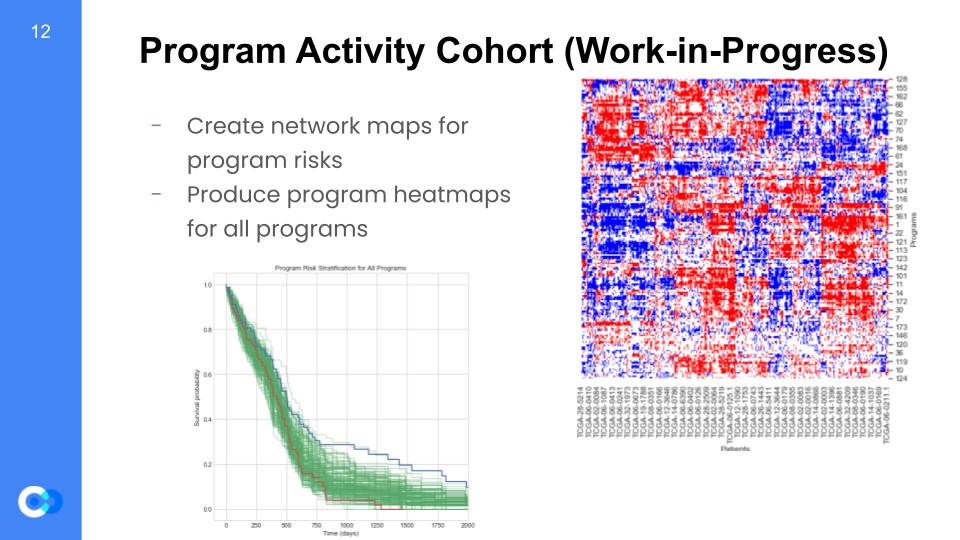
So, why is this important? Well, we are able to create maps for program risks and test for which regulons are high or low risk. For example on the bottom left graph, we can see it is a program risk stratification for every program and tests for survival probability versus the time (in days) that pass. As mentioned before, we can see trends for overexpressed regulons shown as the red trend line, along with the underexpressed regulons shown as the blue trend line. We can see that until around 500 days, the overexpressed and underexpressed regulons are at almost the same survival probability. However, we see that after 500 days there is a huge gap between the two trend lines, such that the overexpressed regulons have a much lower survival probability than the underexpressed. As a result, we can conclude the overexpressed regulons are high risk due to a lower survival probability. Furthermore, we will use patient survival data to create heatmap models regarding the individual’s programs and indicators showing whether the genes are over or under expressive. Since every patient is different, we gain insight into the behaviors of each specific program by a patient basis.
So what are the next steps for this project? One option is to infer and and understand any existing and novel biological pathways that the model infers. This is a good example of using the systems biology approach: considering an element’s interactions with other elements within its system to generate a more accurate model for real world applications. Another next step could be combining all of the Jupyter notebooks we used in the project into one single notebook or python file. This would give ISB’s work a greater outreach and make it accessible to more people who have less of a data science or computational biology background. And there is another direction the project could go in: expanding the use of the MINER algorithm, and other algorithms like it, to more complex diseases. Since MINER has already been used in multiple myeloma and now GBM, it would not be hard to expand its usage to other, more complex diseases that we have yet to understand.