Quoting from the PeptideAtlas website, “The long term goal of the PeptideAtlas project is full annotation of eukaryotic genomes through a thorough validation of expressed proteins.”
In the fall of 2021, members of the Moritz Lab at the Institute for Systems Biology (ISB), including Tami Leppert, Zhi Sun, and Luis Mendoza, partnered with researchers Klaas van Wijk and Qi Sun from Cornell University to create and publish a new build for the proteome of the model plant, Arabidopsis thaliana.
Like the fruit fly and the mouse, Arabidopsis thaliana is frequently studied by researchers around the world. The Arabidopsis proteome has been especially useful for research surrounding gene functions and molecular pathways. Since its establishment as a recognized model plant system in the 1980s, Arabidopsis has been a crucial tool in advancing plant biology. Just last year, PeptideAtlas launched a first build of the Arabidopsis proteome. This build makes accessible valuable information like protein splice forms and post-translational modifications as well as contains detailed profiles of specific proteins.
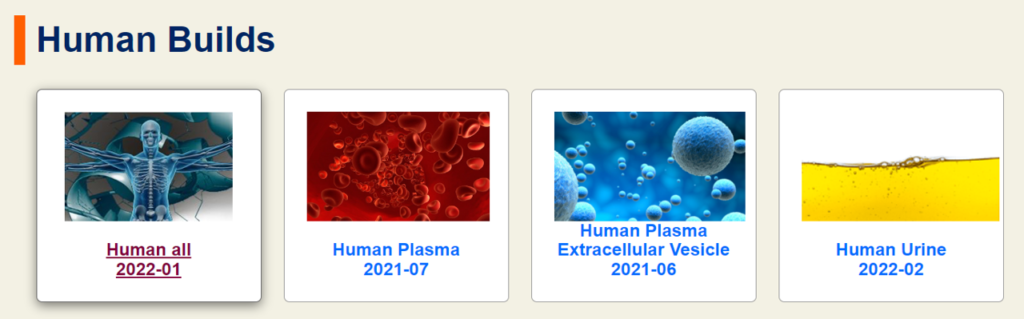
Figure 1.1: The PeptideAtlas website also contains 4 human builds.
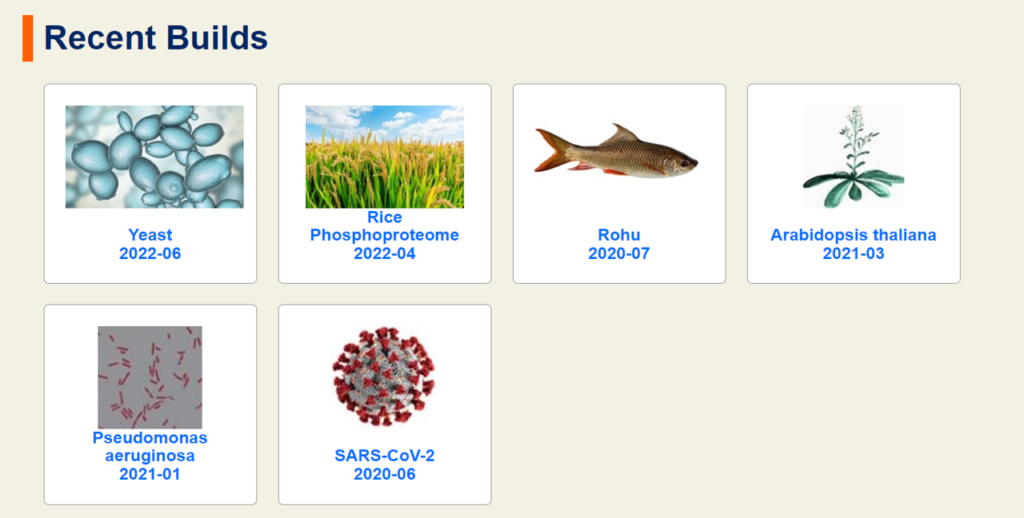
Figure 1.2: Other builds available on PeptideAtlas.
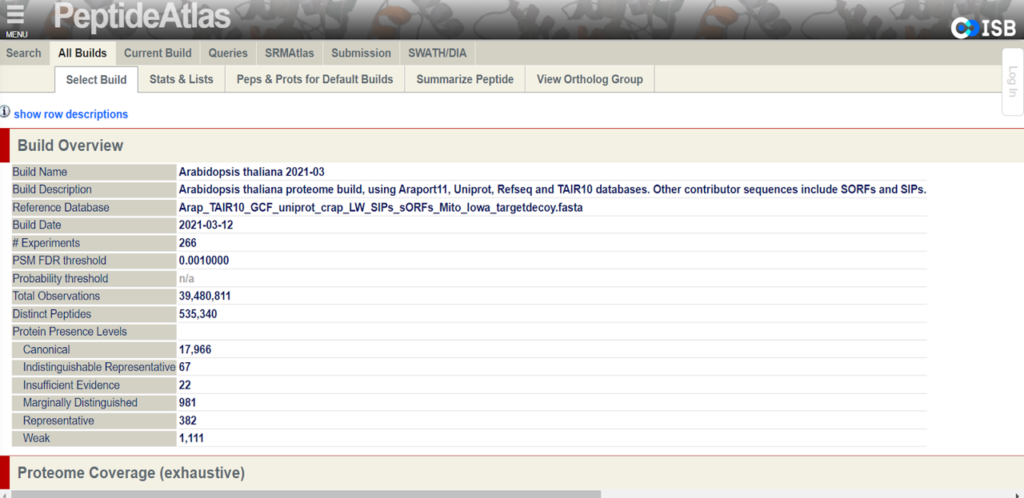
Figure 2: Screenshot of the Build 1 page on PeptideAtlas.
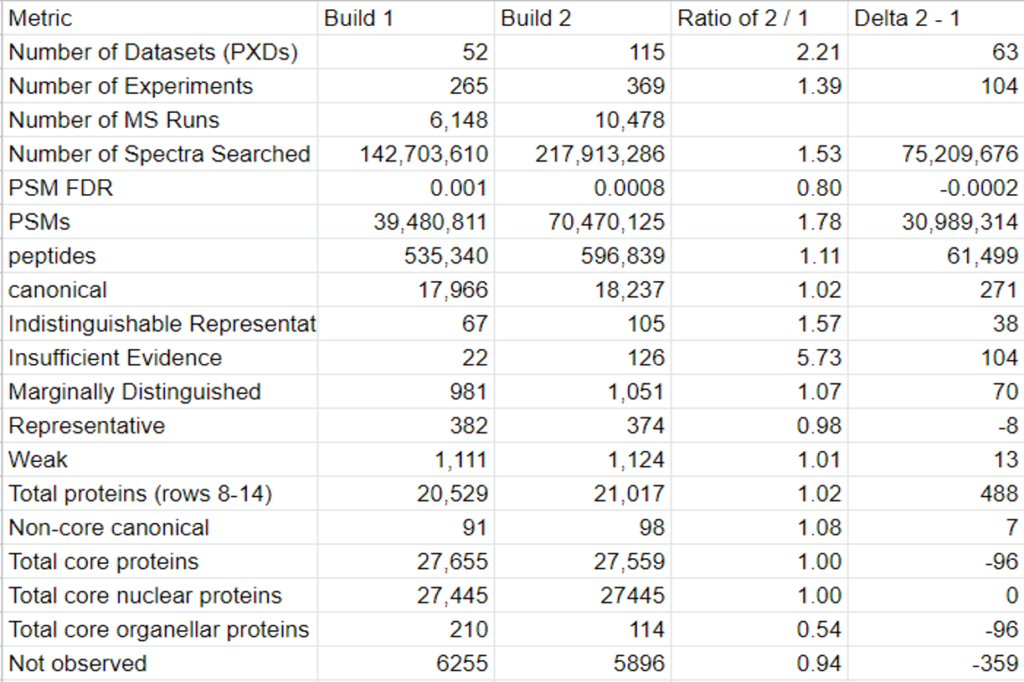
The goal of the second build which will be released in the fall of 2022 is to provide the proteomics community with a more robustly annotated version of the Arabidopsis proteome. Specifically, the second build will include information about previously undetected proteins and more detailed metadata of cited protein datasets. The new data that will be presented on PeptideAtlas primarily comes from the uniform processing of 217 million MS/MS raw spectra from 115 datasets from ProteomeXchange.
Figure 3: Screenshot of a table that summarizes the new changes of Build 2 in comparison to Build 1.
Samples of Our Contribution:
This year, the researchers of the PeptideAtlas project are planning on publishing three papers that document the creation of the second Arabidopsis build as well as the new insights they discovered in their research process. We, the high school interns of this project, mostly contribute by generating figures for the research papers that illustrate the research process. These figures can take the form of Excel tables or graphs. In the process of accomplishing these tasks, we also help extract, clean, and organize research data.
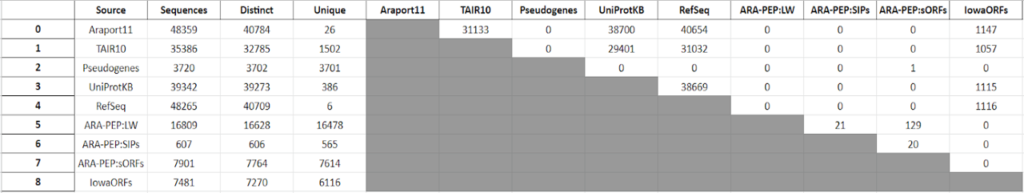
Figure 4: An Excel table we generated that compares the overlaps between the arabidopsis protein sequences in 9 distinct sources. The identifiers, sequences and descriptions of proteins from each source are stored in .fasta format files. Additionally, statistics of each file such as total number of sequences, number of distinct sequences, and number of sequences unique to the file are calculated and displayed for each .fasta file.
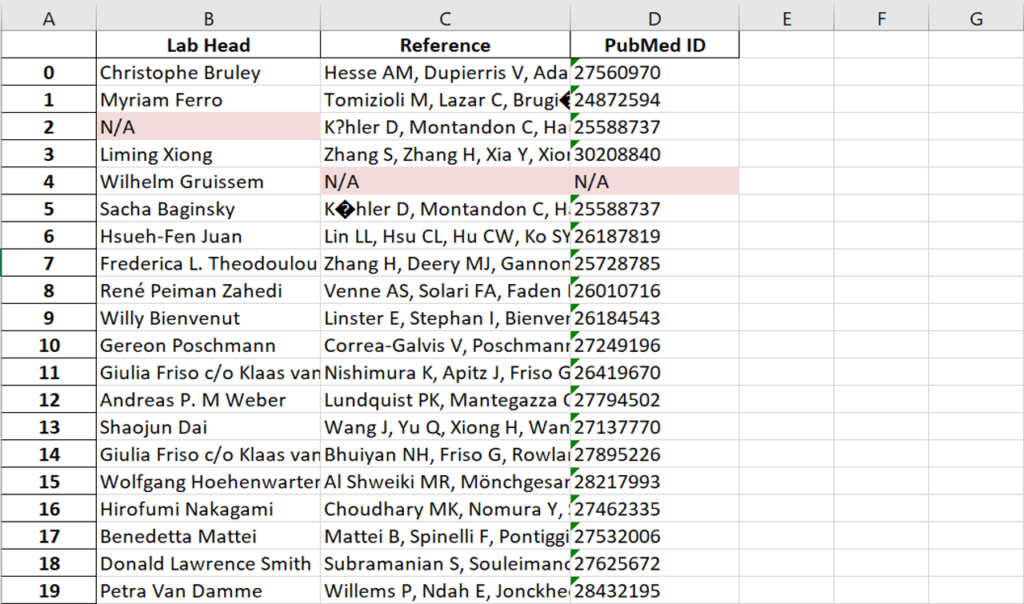
Figure 5: Sample metadata of ProteomeXchange datasets collected from the datasets’ respective profiles on ProteomeXchange. To extract the data, we developed programs that webscrape in json and html. The results are then stored in a Pandas dataframe and written to Excel.
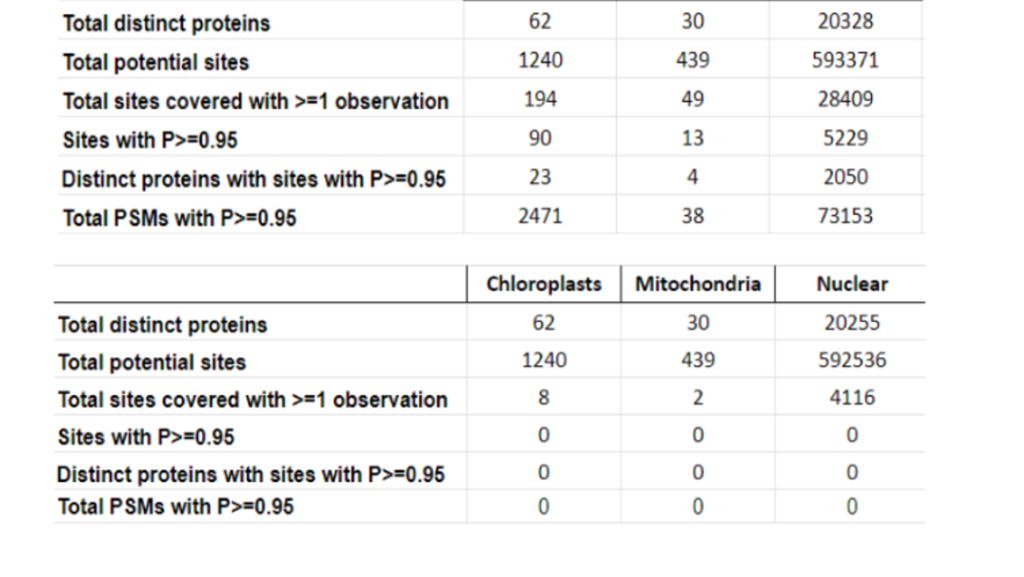
Figure 6: Sample post-translational modifications (PTMs) statistics we tallied. We used an Excel table generated by our mentor that contains details regarding PTM sites and constructed summary tables for phosphorylation, acetylation, glycosylation, and ubiquitination.
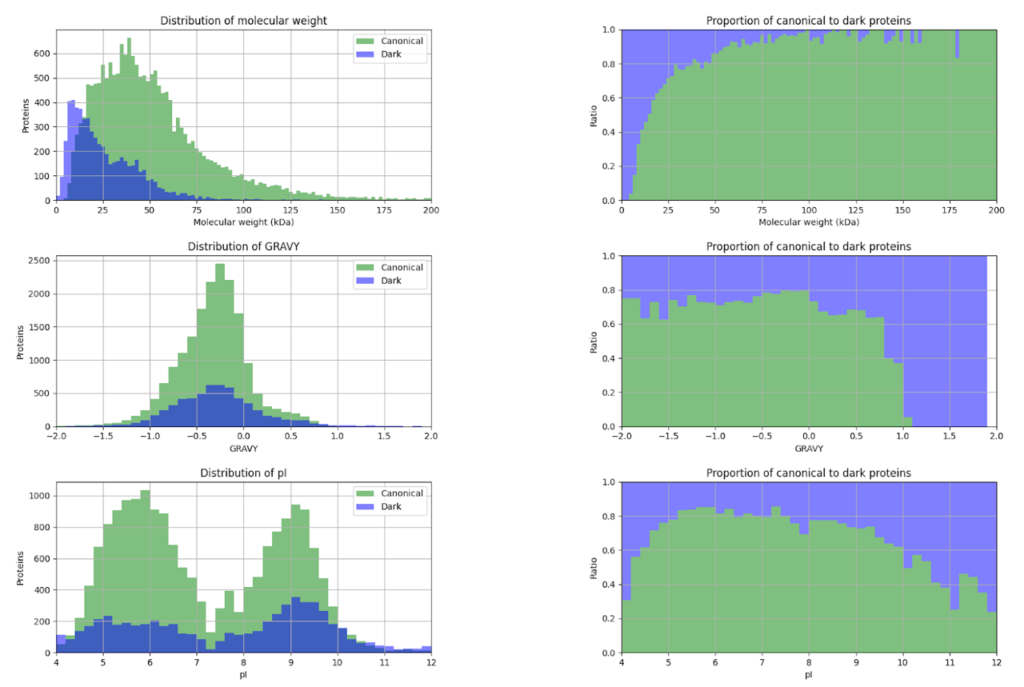
Figure 7: Sample histograms we generated to visualize the distribution of light (canonical) and dark (unobserved) proteins in terms for attributes such as molecular weights, GRAVY, and pI. To accomplish this, we primarily used functions of the Python Matplotlib library.
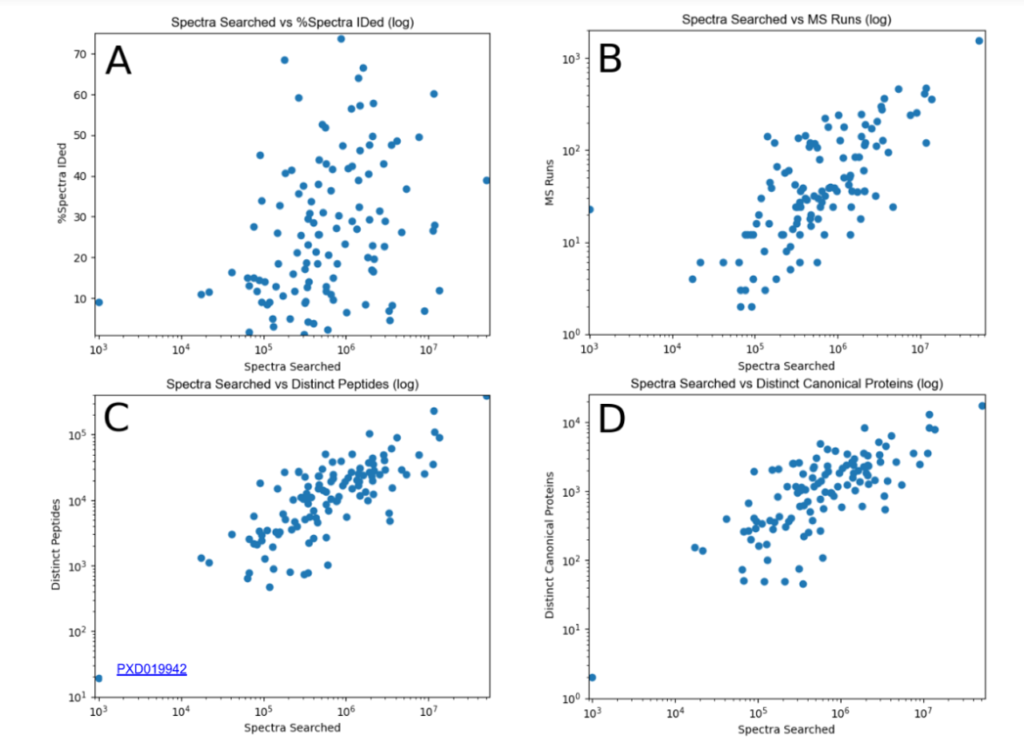
Figure 8: Sample scatter plots we generated to visualize the correlation between different attributes of build2 datasets. The full data table can be found on the Arabidopsis build 2 page on PeptideAtlas under the title “Data Contribution”. These graphs are primarily generated with the Python Matplotlib library.
Acknowledgement
We would like to thank our mentor, Eric Deutsch for answering our never-ending well of questions and for helping us explore the complexities of his research with the greatest patience. Thank you to Claudia Ludwig, Miranda Johnson, Becky Howsmon, Jen Eklund, and of course, Nitin Baliga for guiding us through the internship experience and making this opportunity the most wonderful it could have been. Thank you to Jim Heath, Eric Deutsch, Lee Hood, Guangrong Qin, Dave Gibbs, and Anya Shukla for letting us interview you and generously sharing your experiences. Lastly, thank you to the people of ISB for being so friendly and welcoming to us. We are so, so grateful for all of you.