Intern partners Zainab Neemuchwala and Onyie Okoye worked with Alex Carr from the Baliga Lab and Gibbons Lab this summer on a project focused around the human gut microbiome. See what they researched down below!
Abstract
The Human Gut Microbiome contains many bacteria that are significant to human health. In order to identify what defines a healthy microbiome and prevent disease, it is important to look at and analyze factors that cause changes in abundance, alpha (within one sample), and beta (between two samples) diversity. The goal of this project was to characterize how smoking and exercise frequency as well as geography and alcohol consumption impact microbiome composition and diversity using The American Gut Project. We deepened our coding skills, read scientific literature, and learned the importance of computational biology during this project.
Introduction/Background
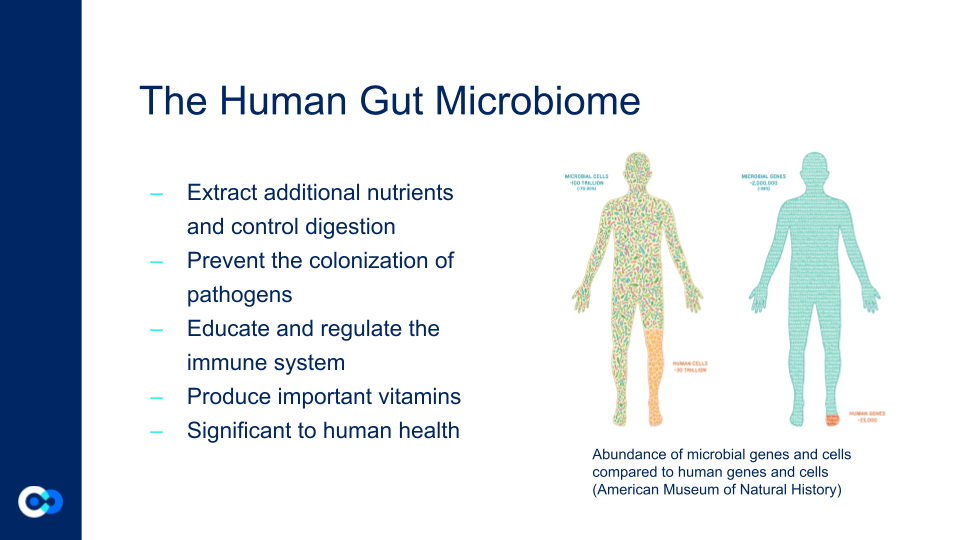
The Human Gut Microbiome contains many bacteria that are significant to human health. Its roles include extracting additional nutrients from our diets, controlling digestion, preventing the colonization of pathogens, educating and regulating the immune system, producing important vitamins, and more. Our gut microbiome contains more bacterial cells than the rest of the cells in our body. The human microbiome plays an important role in human health and disease. There are many different lifestyle factors that have a role in the human gut microbiome including sex, age, lifestyle, diet, geography, and more. Looking at differences in the microbiome can help us gain a better understanding of how to keep ourselves healthy and prevent microbiome diseases.
Methods/Process
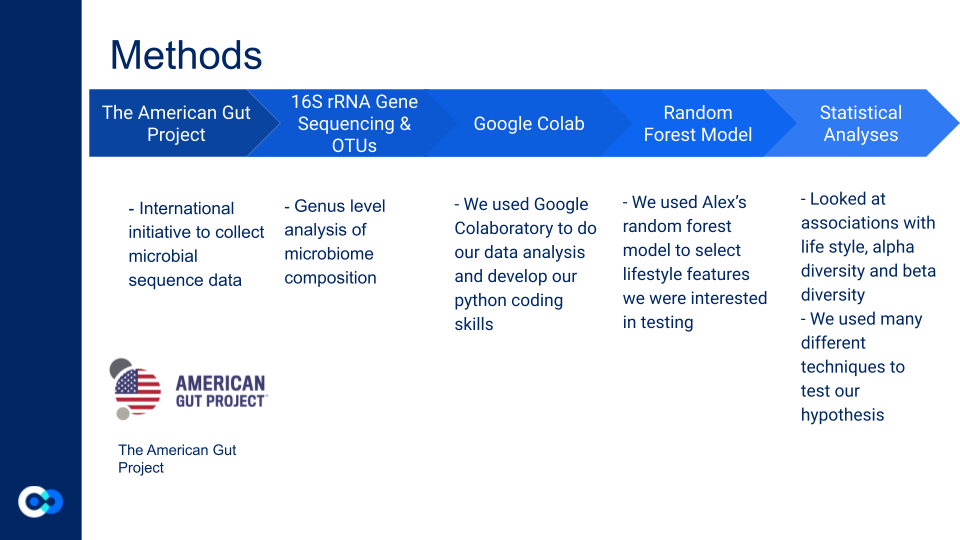
Above is a description of our approach to looking at different factors in the microbiome.
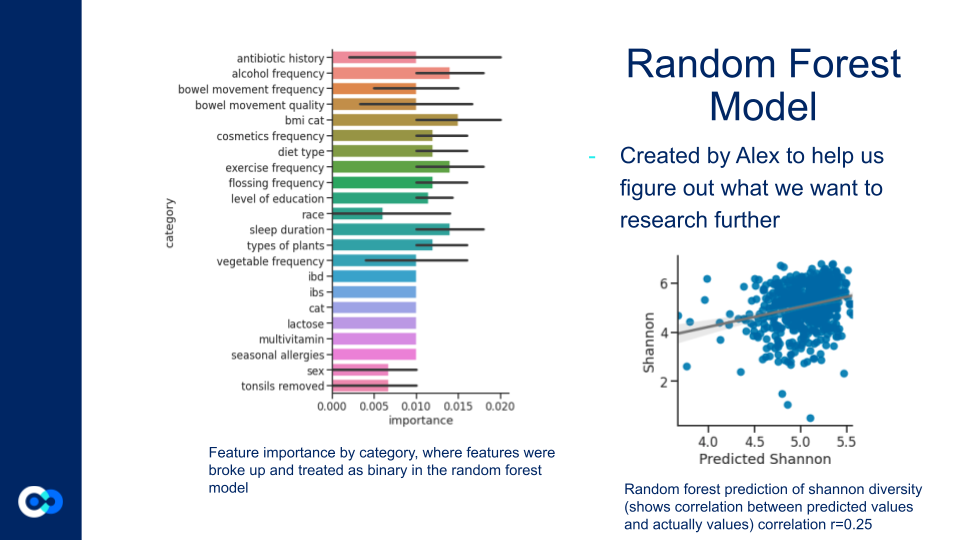
Random Forest Model
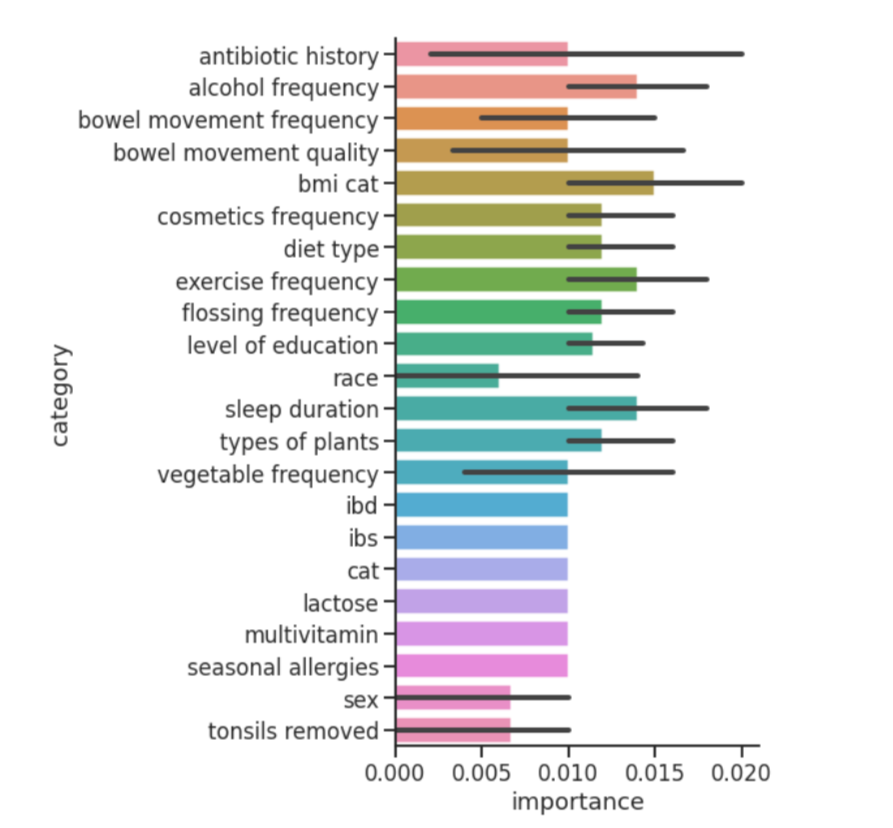
The Random Forest Model helped us justify what features to further investigate by revealing which metadata factors had the strongest effect on microbiome diversity. While there were many significant factors, we ended up focusing on alcohol consumption frequency, country of residence, smoking frequency, and exercise frequency.
Research Questions
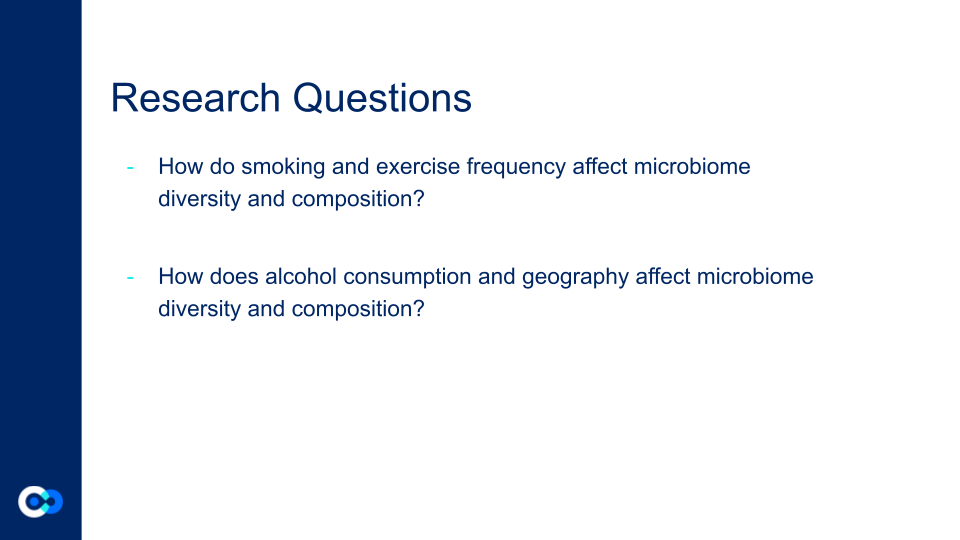
How do smoking and exercise frequency affect gut microbiome diversity and composition?
How do alcohol consumption and geography affect gut microbiome diversity and composition?
Techniques
To visualize the data and put our coding skills into practice, we used many different techniques when analyzing The American Gut Project database. These included PCA (Principal Component Analysis), Linear Regression, Heatmaps, Hypothesis Testing (t-testing), Random Forest Models, Alpha Diversity (differences between one sample), and Beta Diversity (differences between several samples).
Results
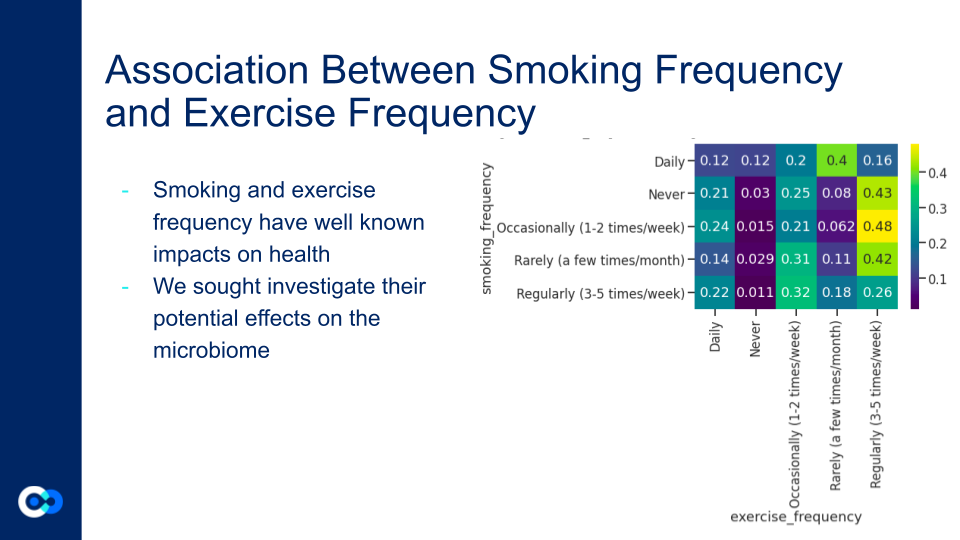
Smoking and exercise both independently have opposing effects on the microbiome, smoking reduces diversity, while frequency exercise maintains higher levels of diversity. Lower diversity puts the gut microbiome at significant risk, as not only is it less effective it nutrient processing, but it is a greater risk of colonization by an invasive species (as a result of an illness). The heat map reveals that 52% of the daily smokers in the dataset exercise either rarely or never, while 64% of those who never smoke exercise daily or regularly. This shows that there are two strong groups of significant size: smokers who don’t exercise and non smokers who do. Since smoking and exercise both have strong effects individually, Onyie wanted to inquire into their effects when combined.
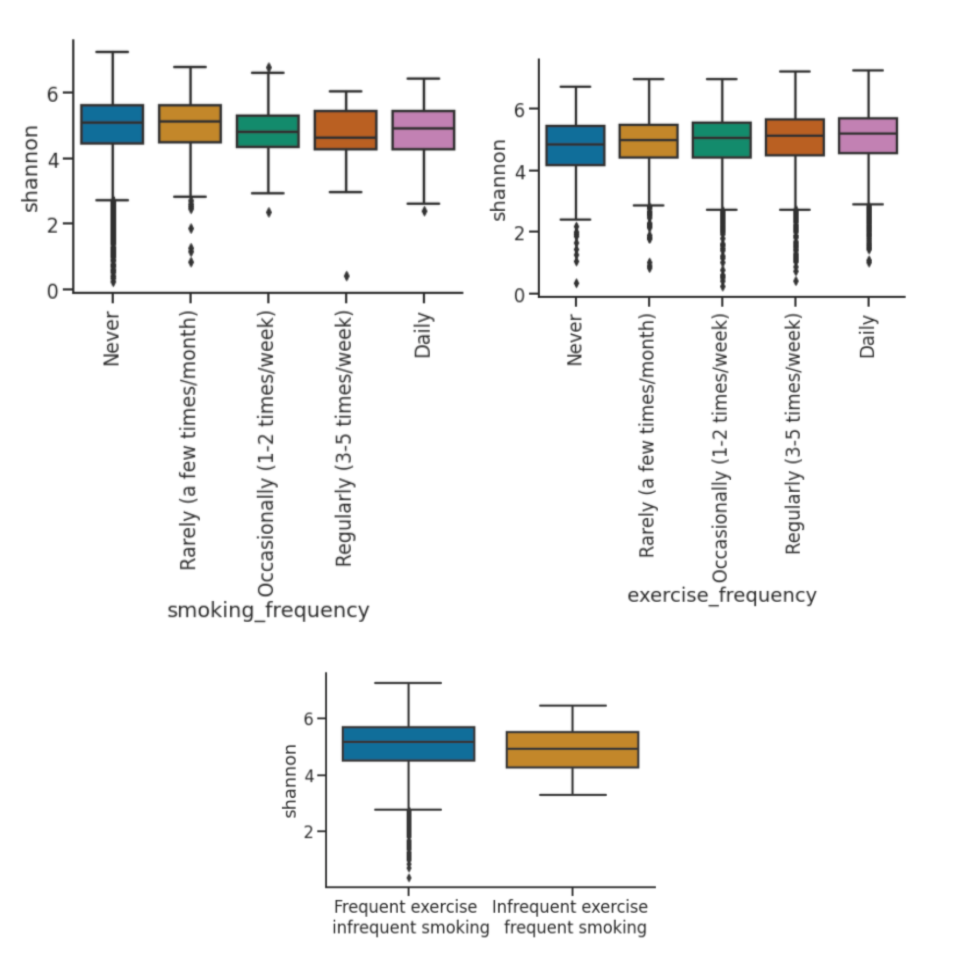
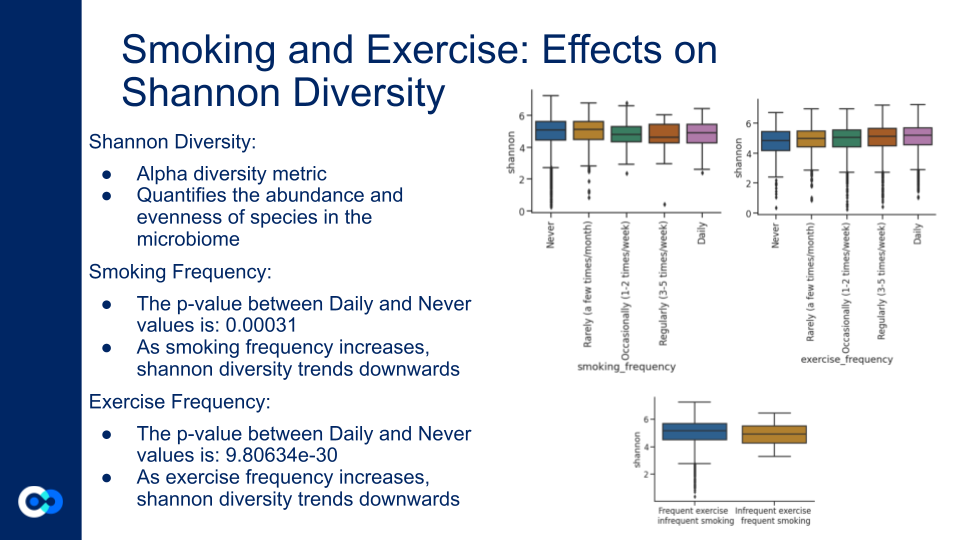
Smoking and exercise frequency showing inverse trends in shannon diversity. Shannon diversity is an alpha diversity metric that quantifies the abundance and evenness of species in the microbiome. For smoking frequency, every frequency higher than never shows lesser shannon diversity. For exercise, the opposite trend is exhibited, where every frequency higher than never shows greater shannon diversity. This proves supports that exercise and smoking are both influential and counteractive.
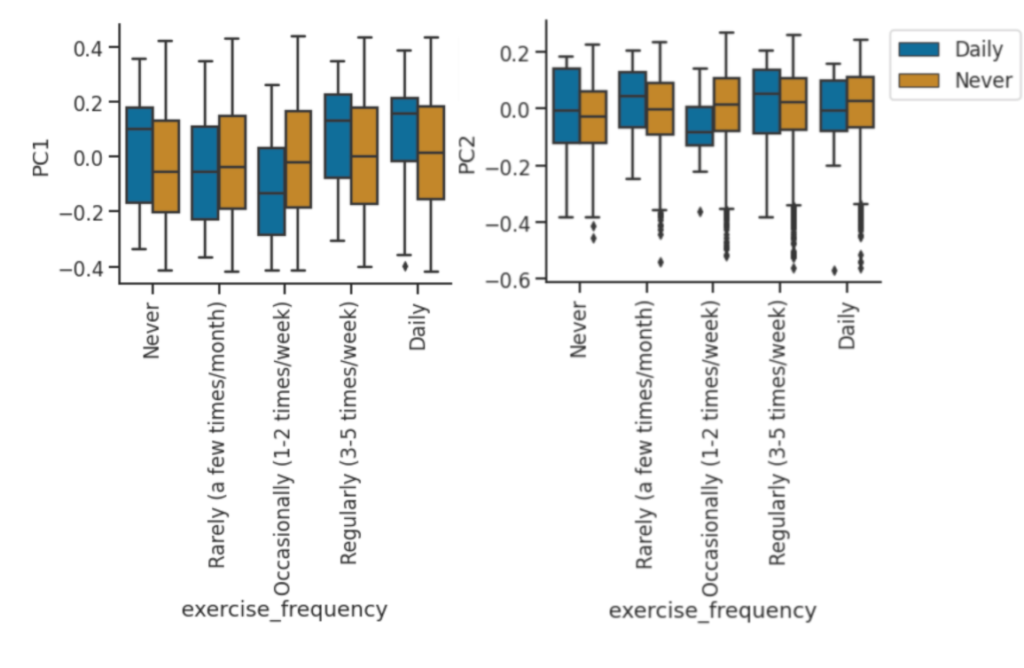
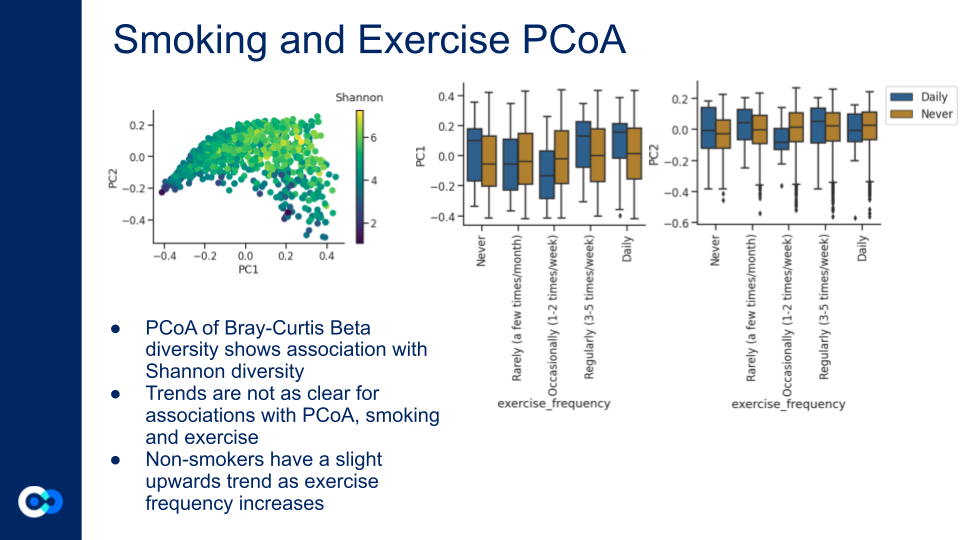
PCA of exercise frequency with smoking (Daily, Never). Non-smokers have a slight upwards trend as exercise frequency increases.
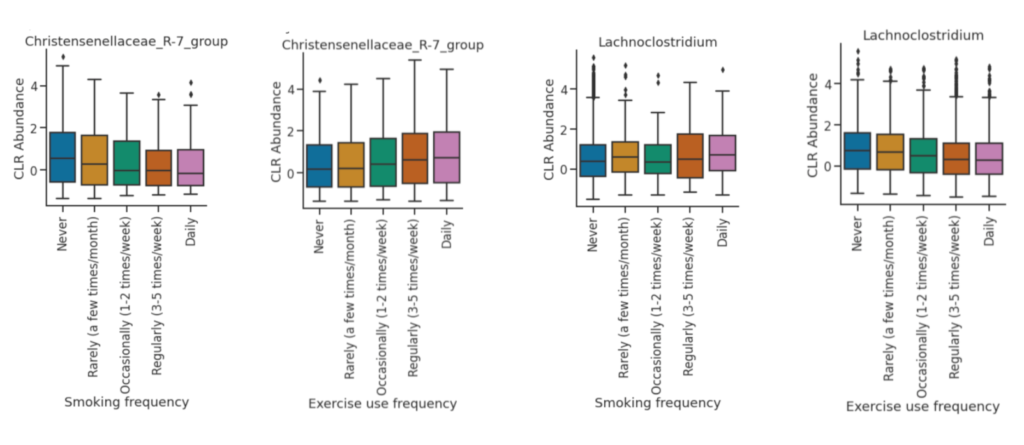
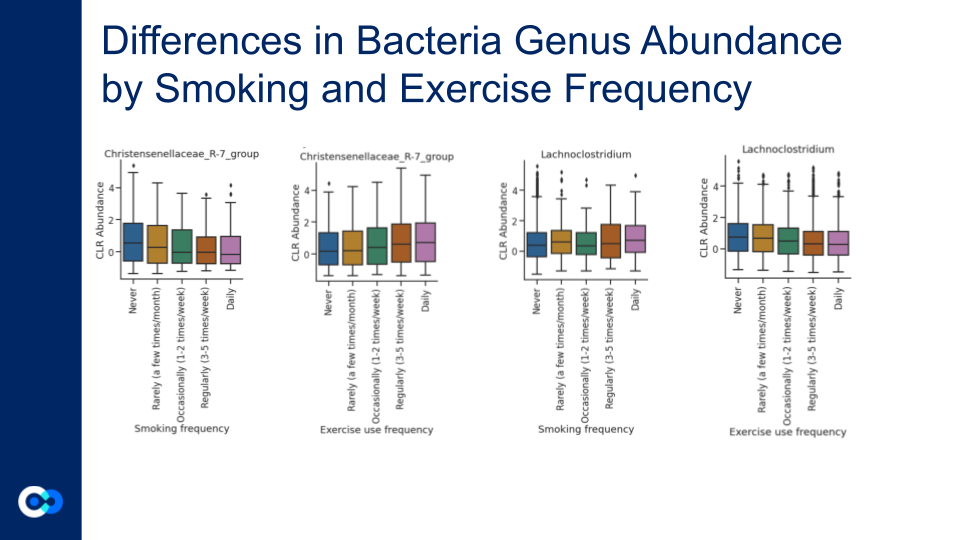
For the CLR abundance, there are significant opposing trends seen in the Christensenellaceae R-7 group and the Lachnoclostriduim group. For the Christensenellaceae R-7 group, the abundance decreases as smoking frequency increases, and the abundance increases as exercise frequency increases. For the Lachnoclostridium, the abundance increases as smoking frequency increases, and the abundance decreases as smoking frequency decreases. Lachnoclostridium is a faecal bacterial markers for diagnosing adenoma, which is an precancerous of colorectal cancer.
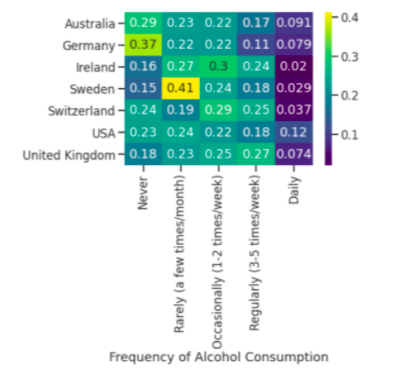
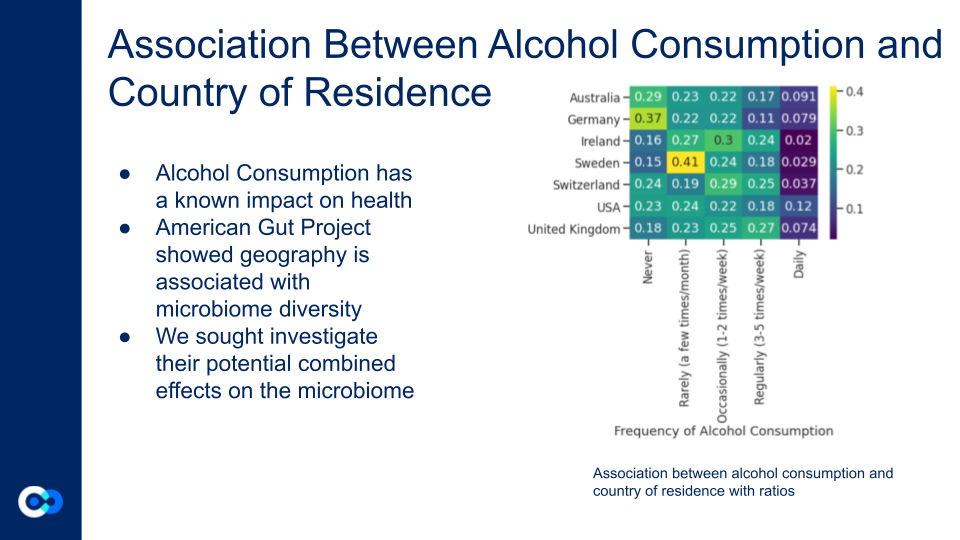
Ratios are the number of people in that frequency divided by total of alcohol consumption based on country. Sweden has the most amount of people who rarely drink alcohol. The USA has the largest amount of people who drink daily. Germany has the most amount of people who never drink. Ireland has the largest number of people who occasionally drink.
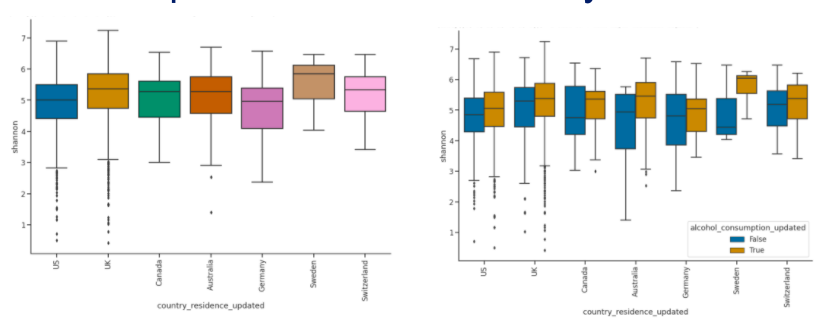
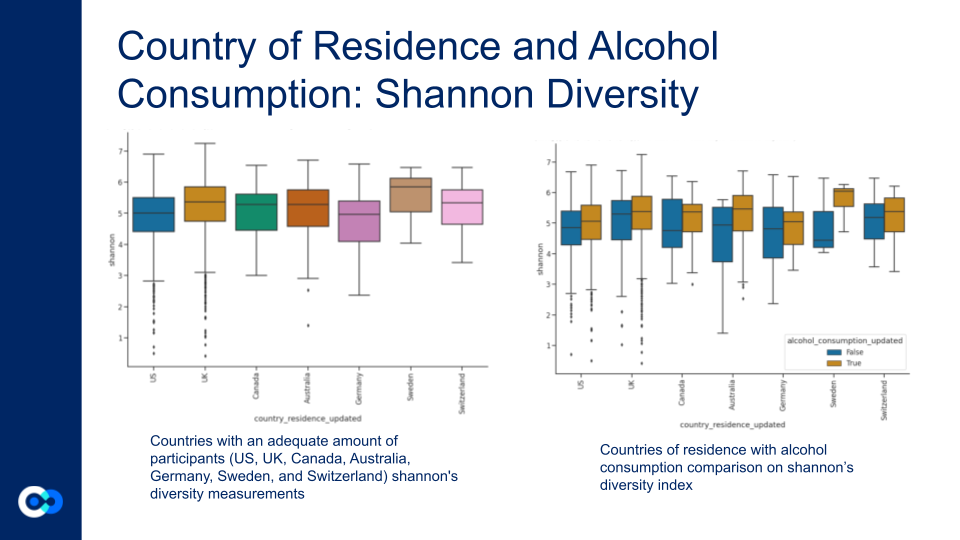
Country of residence measured on shannon diversity. The plot on the left is without alcohol consumption, and the plot on the right is with alcohol consumption. Alcohol consumption had a higher shannons diversity index.
True: Daily drinking, False: Never drinking
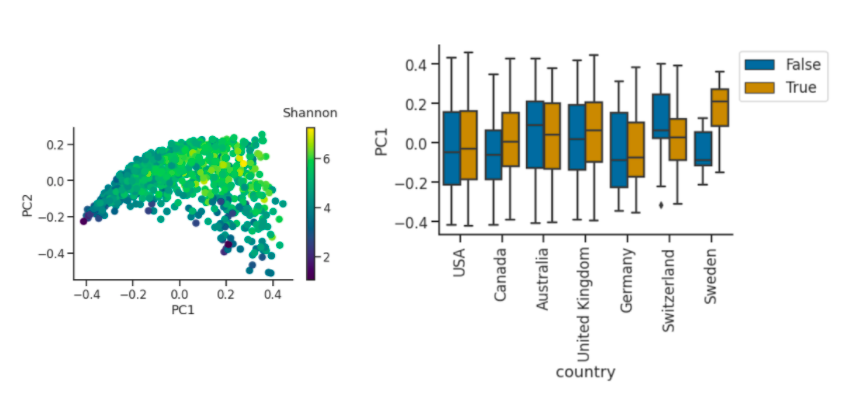
Left plot is a PCoA (Principle Coordinate Analysis) of Bray-Curtis Beta diversity shows association with shannon diversity. Right plot has an outlier of Sweden and the trends aren’t consistent but there are differences between countries.
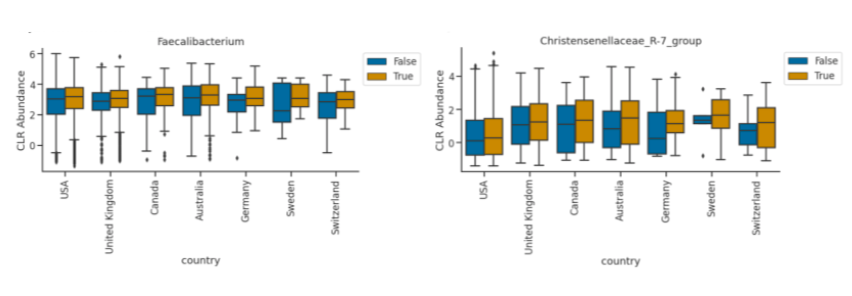
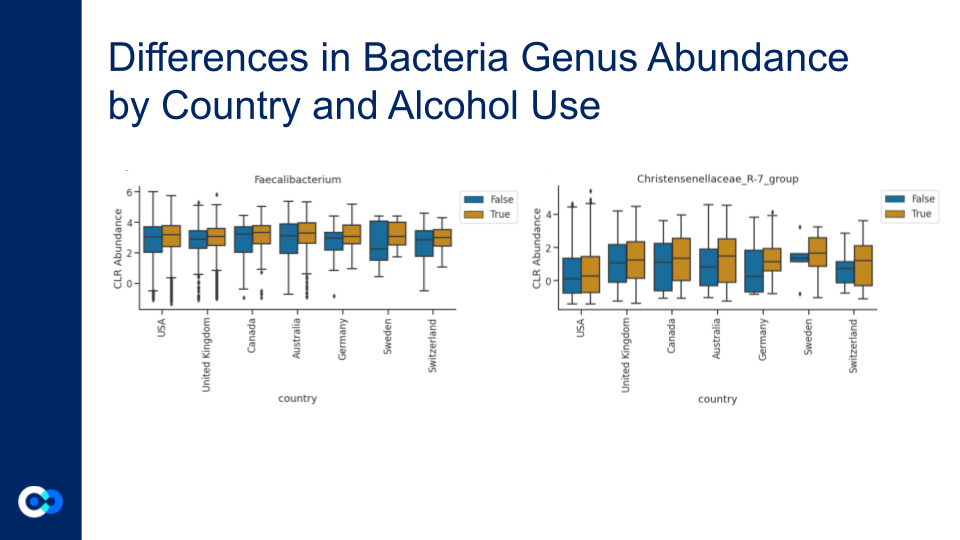
Bacteria that are important to the process of fermentation were present. Faecalibacterium is an abundant bacteria in the microbial community.
Conclusions/Takeaways
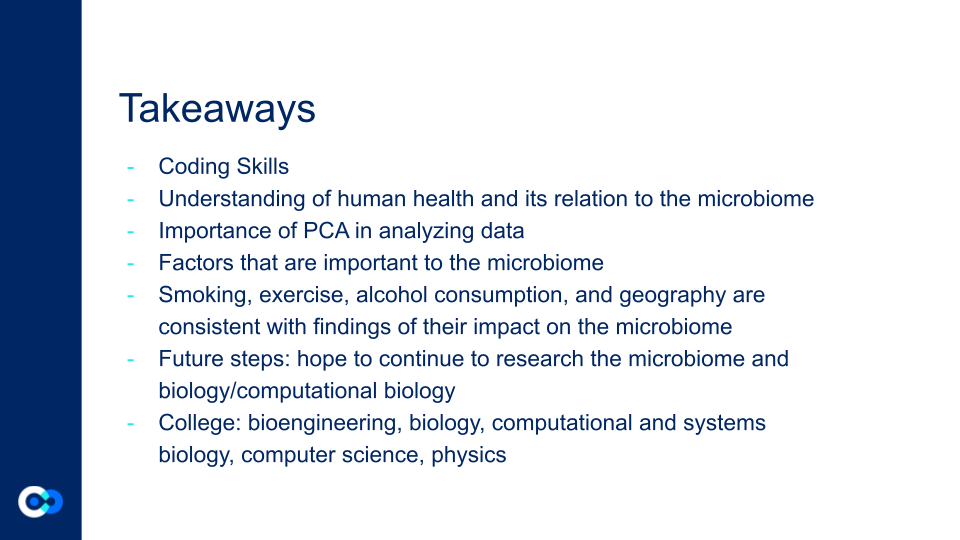
Through our research project, we came to understand the scale at which the human microbiome influences human health. We learned several data analysis skills, one of the most important and broadly applicable being PCA and PCoA. We hope to develop our skills in research now that we have been immersed in the environment. In university, we are both heavily interested in pursuing courses in relation to what we practiced during this internship. Our analyses showed us how variation in the microbiome can be associated with lifestyle, health and disease and the importance of investigating these relationships. Changes in the microbiome are associated with many different diseases, and thus it is critical that we figure out how to maintain the balances in bacterial abundance needed for a healthy microbiome. To further our work, it would be best to continue analyzing the many other factors in the microbiome from the Random Forest Model to gain a better understanding of what a stable and unstable microbial environment looks like.
Acknowledgements
We would like to thank Alex Carr for his mentorship and guidance, we could not be more grateful for our experience this summer. In addition, we would like to thank the SEE team- Rachel Calder, Claudia Ludwig, and Becky Howsmon for all their hard work and support they gave this summer. Additionally, thank you to the Baliga and Gibbons Labs for letting us intern this summer and broaden our learning with your presentations. And thank you to everyone else at ISB!
Please refer to the Acknowledgments page!
If you have any questions or would like to get more information on this project and our results, please feel free to reach out to either Zainab at zainabhn@gmail.com or Onyie at onyieokoye@gmail.com.
Here is the full project presentation:

