Intern partners Pranati Mitta and Maria Protogerou worked with Dr. Vivek Srinivas from the Baliga Lab this summer on a project centered on analyzing bacterial responses of Mycobacterium tuberculosis (Mtb) to different antibiotic drugs. See what they researched down below!
Abstract
During this experiment, we studied different samples of Mtb. Additionally, eight different antibiotics at different concentrations and time points were taken in order to analyze their impact on the amount of differential gene expression and the bacterial phenotype. Different methods of analysis were used including the machine learning algorithm known as the Drug Response Analyzer (DRonA), differential gene expression analysis, and gene enrichment analysis. It was found that the amount of differential gene expression increased as the concentration and antibiotic time exposure increased unless the Eagle Effect impacted a specific sample. A majority of the differentially expressed gene functions were correlated with cellular metabolic processes. Many of these processes are necessary in combating the severity of TB infection.
Background/Aim
Mycobacterium tuberculosis (Mtb) is a non-motile, slow growing, rod-shaped bacillus. It spreads through respiratory droplets containing tubercle bacillus. These droplets smaller than 1-2 µm enter lower respiratory tract and lungs. Most infected individuals contain TB within a granuloma, or an aggregate of immune cells that walls off the mycobacteria, but does not eradicate them.
While initially looking at 8 different antibiotic drugs, we focused specifically on linezolid (LZD) and clofazimine (CFZ) because they are secondary TB drugs that are soon becoming a front line treatment as new research on them continues.
Linezolid is a monoamine oxidase inhibitor that is used to treat different types of bacterial infections such as pneumonia and various skin infections. Clofazimine binds to guanine bases of bacterial DNA and blocks its template function in order to inhibit bacterial proliferation. It is typically used to treat a form of leprosy (or Hansen’s Disease) known as lepromatous leprosy.
Throughout this project, we studied Mtb to understand how different antibiotics at different concentrations and chronic exposures affect the expression of Mtb genes related to drug tolerance.
Expected Results
In studying Mtb expression in response to varying antibiotic properties, there were several general trends we expected to observe.
When the antibiotic drug concentration (xMIC – minimum inhibitory concentration) as well as chronic exposure (hours) increased, higher antibiotic action was expected up to a certain degree. Additionally, in terms of cell growth, it was expected to observe higher cellular activity in replication and division pathways as well as an increased rate of metabolic action. Conversely, in a dormant phenotypic state, it was expected to observe diminished cellular activity in the replication and division pathways, in addition to lower metabolic action. In the phenotypic stage outlining cell death, it is expected to observe an increase in reactive oxygen species, perforation of the cellular membrane, breaking up of DNA and RNA, degradation of proteins, as well as an increase in toxin proteins in the cell.
Methods/Process
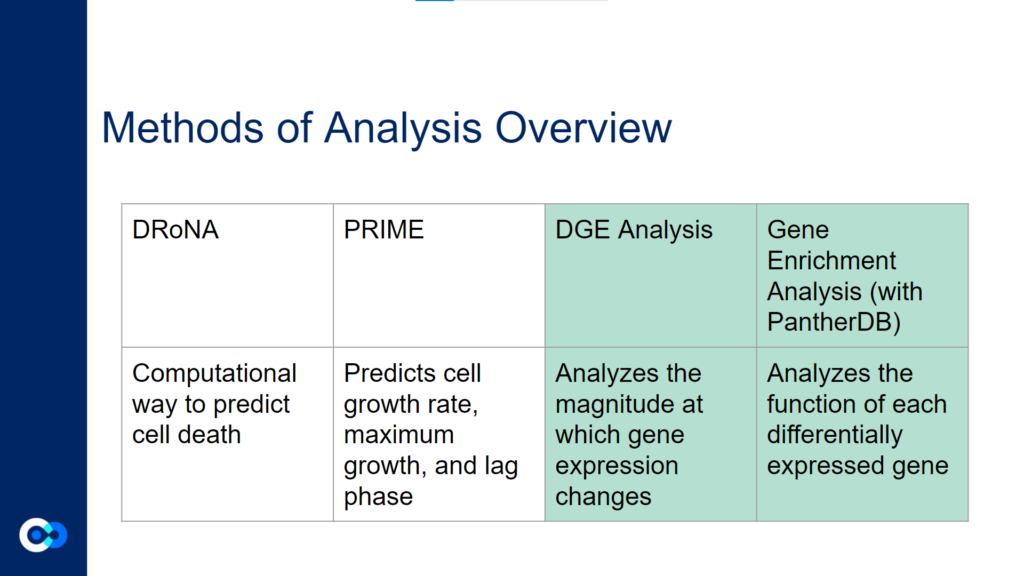
The main tools we used as methods of analysis were machine learning algorithms DRonA and PRIME– which were useful in identifying cell phenotypic states– as well as differential gene expression (DGE) analysis and gene enrichment analysis (GEA). The main functions of each of these instruments are outlined below. Due to time constraints, we were unable to use PRIME in our transcriptome analysis for the time being and had to substitute PRIME with DGE analysis and GEA.
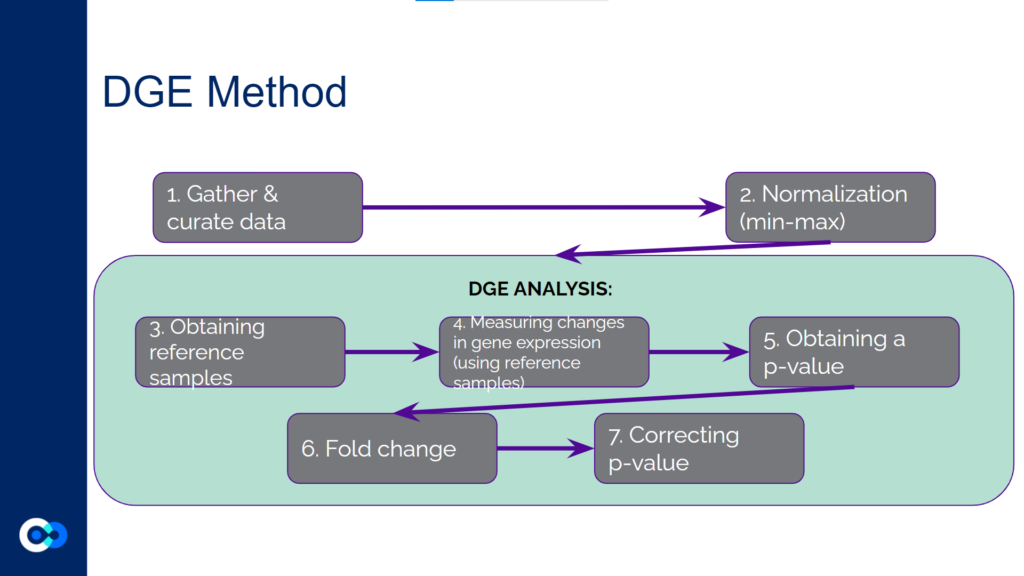
DGE analysis was a crucial step in our project as it helped to provide measurable conclusions about the degree to which we were able to observe changes in differential gene expression in varying exposure conditions of Mtb.
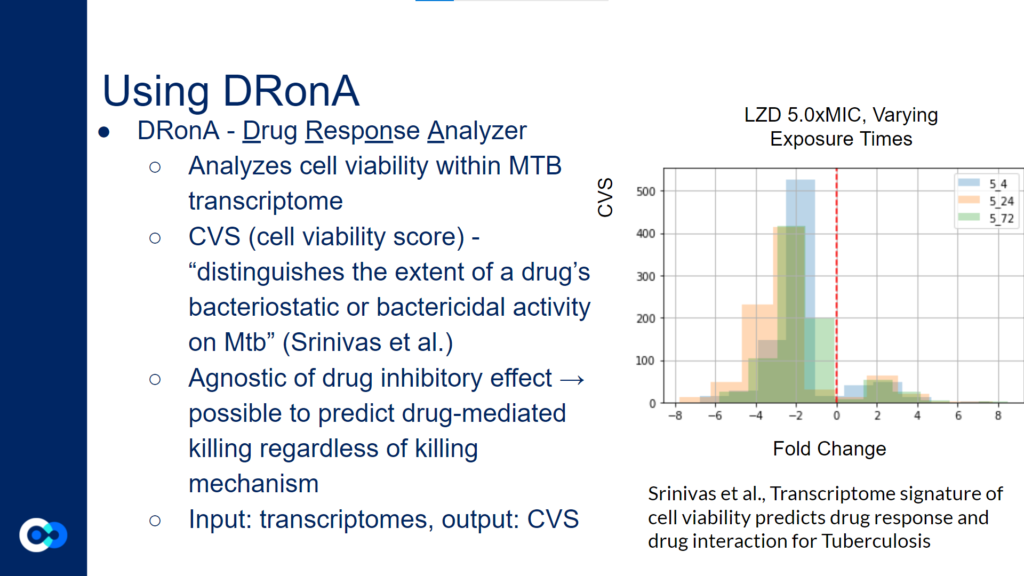
DRonA is a machine learning algorithm that is useful in predicting how effective an antibiotic drug is in stopping bacterial growth and aiding in bacterial killing. Using numerical values to evaluate a drug’s bactericidal and bacteriostatic activity, a cell viability score (CVS) is calculated, measuring the efficacy of the drug treatment.
Results
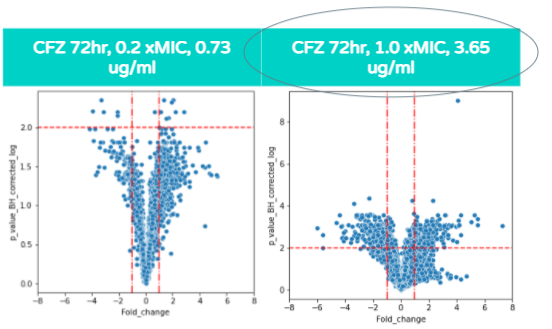
As shown in these volcano plots, as the concentration of CFZ increases, the amount of gene expression increases as well (and the highest amount of fold change occurs at 1.0xMIC).
This is demonstrated through the plots at 0.73 micrograms/mL (on the left graph) reaching a fold change of +/- 4 whereas in the 3.65 ug/ml graph (on the right), the plots reach a fold change as high as +/- 6.
Also, a majority of the plots in the 0.73 ug/ml volcano plot show the p value corrected log to be under 2.0 and therefore, the majority of differentially expressed genes are not significant. In contrast, the majority of plots in the 3.65ug/ml volcano plot show the p value corrected log to be over 2.0, indicating that the majority of differentially expressed genes at that concentration are statistically significant.
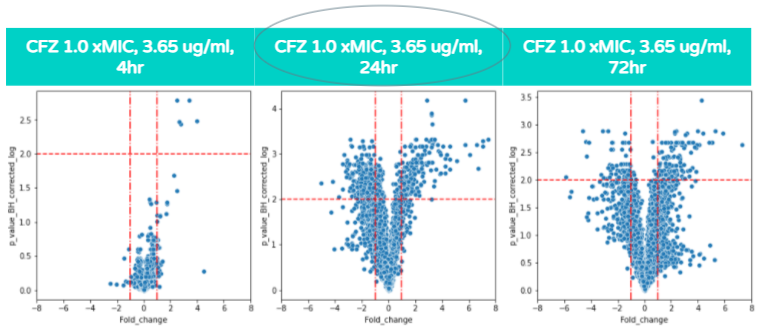
Unlike the previous volcano plot, as the hours of CFZ treatment increases the amount of gene expression does not always increase, and the highest amount of statistically significant differential gene expression occurs at 24 hours. The amount of gene expression increases only from 4 to 24 hours, while from 24 to 72 hours, the amount of gene expression does not significantly increase. This is because the increased exposure to CFZ allows the bacteria to gain resilience towards the antibiotic. This concept is associated with the Eagle Effect which is explained in further detail a few sections below.
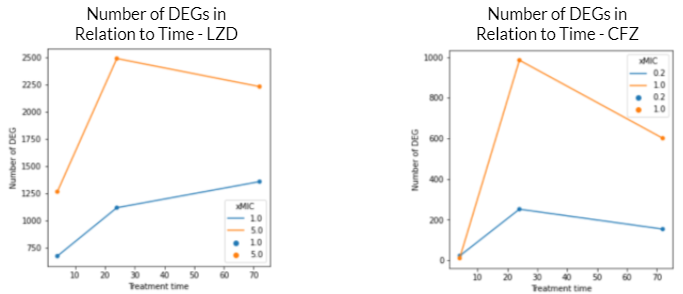
These graphs reflect a similar trend shown in the volcano plots above. For both graphs, the DEGs at 5.0 xMIC are generally expressed at a higher scale than at 1.0 xMIC. Additionally, regardless of the drug, the rate at which DEGs are expressed seems to generally be slower at lower concentrations. For both drugs, it appeared that the time point at which significant change in differential gene expression was noted was close to 24 hours. Interestingly, in the 1.0 xMIC LZD treatment, the DEGs did not decrease in number after 24 hours – this is likely due to the fact that LZD at 1.0 xMIC was not effective enough to significantly impact the number of DEG, or to slow the growth/kill Mtb bacteria. For all other conditions outlined by the graphs above, the number of DEGs seems to decrease after 24 hours, likely due to the bacteria stimulating drug-fighting responses.
Discussion/Conclusion
The Eagle Effect, originally discovered by Henry Eagle in 1948, highlights the idea that an increase in antibiotic concentration may lead to an increased proportion of surviving cells.
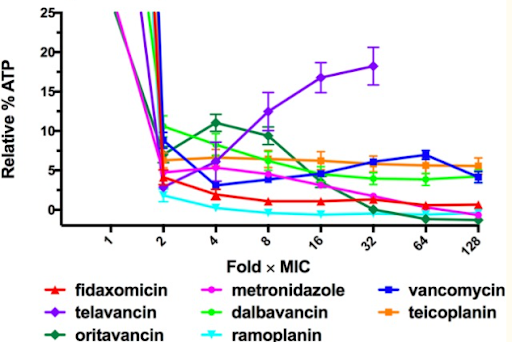
Jarrad et al., Detection and Investigation of Eagle Effect Resistance to Vancomycin in Clostridium difficile With an ATP-Bioluminescence Assay, 2018
This graph shows a previous study which demonstrates how a majority of bacterial cells exposed to higher concentrations of antibiotics exhibited a decreased rate of cell death. However, the Eagle Effect only impacts certain antibiotics and bacteria at specific concentrations and/or time points. For instance, in the graph above, most of the antibiotics reflect the impact of the Eagle Effect as the relative % ATP decreases as the fold xMIC increases. Yet, with certain antibiotics like telavancin as shown with the purple line, the relative % ATP increases as the Fold xMIC increases. Therefore, in this experiment, the telavancin treatment does not reflect the impact of the Eagle Effect. Generally, the Eagle Effect impacts several species including Gram positive bacteria, Gram negative bacteria, mycobacterium, and fungi.
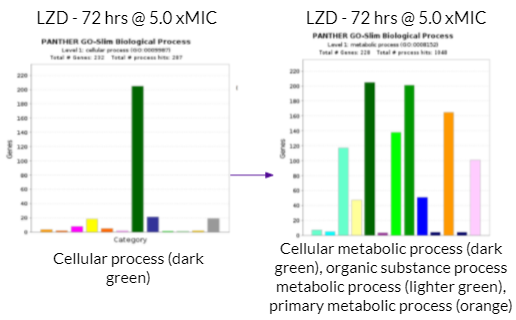
There was a high volume of metabolic reactions within the growth cells. This included building up/breaking down reactions related to the anabolism and catabolism of the metabolism in the bacteria. Additionally, ATP production is involved in the metabolic reactions within growth cells. As mentioned above, different drug concentrations had different margins of effectiveness. Generally, higher drug concentrations were more effective in eliminating the bacteria. The bar graph on the left with the singular dark green bar represents cellular process in terms of the biological processes occurring within the Mycobacterium cells. The bar graph on the right provides a more in depth look at what the cellular process consists of. On the bar graphs on the right side, the dark green bar represents cellular metabolic process, the lighter green bar represents organic substance metabolic substance, and the orange bar represents primary metabolic process. Therefore, a large majority of the gene activity the cell relates to its metabolism.
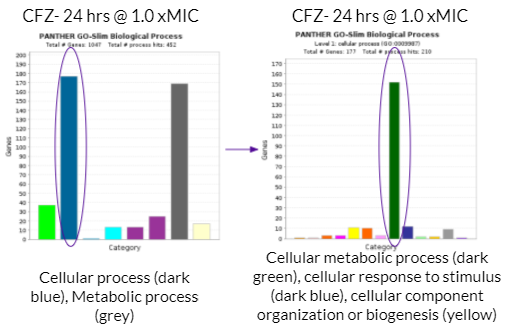
As mentioned previously, a majority of significantly differentially expressed genes for CFZ treatment occurred at 24 hours and at 1.0 xMIC. The total number of genes that were significantly differentially expressed was 1,047. The biological process that housed a majority of the gene’s function (177 genes) were under the category of cellular process as shown with the dark blue colored bar on the bar graph towards the left. Cellular process is essentially any process done at the cellular level which includes the growth and repair of cells as well as maintaining homeostasis. Within this category of 177 genes, a majority of gene functions (152 genes) were involved in cellular metabolic processes as shown with the dark green bar on the bar graph towards the right. Cellular metabolic processes are necessary in maintaining homeostasis within the body after it has been attacked by TB. Additionally, these gene functions are necessary for the body’s recovery from TB. More specifically, cellular metabolic processes are needed in order to maintain cholesterol levels within the body, which may be depleted after a TB infection. This is because Mtb metabolizes cholesterol throughout the course of infection. This is harmful to the human body because cholesterol is used to build the structure of cell membranes and make hormones (such as adrenal hormones to regulate metabolism). The expression of these genes (which increases cholesterol levels) may reduce the severity of the impact that Mtb has on one’s body.
Future Directions/Takeaways
With the knowledge we have gained from this project, we have a better understanding of how antibiotics can affect bacterial response and how we can note bacterial responses and activity using gene enrichment analysis as well as differential gene expression analysis. In order to help further our research in the project before the internship ended, we had the chance to learn more about PRIME and how it can be used to measure cell growth within bacterial samples. While we are amazed at how much we accomplished during this 8-week internship, we also understand how much more there is left to learn within this project. This fuels our curiosity to not only delve deeper into this project, but research more about related topics and study new problems.
This 8-week internship has been an incredible opportunity for which we are extremely grateful for! We were able to see what a real work environment and schedule is like. Each Research in Progress Meeting and Baliga Lab meeting has shown us the power of STEM and science education. We were able to view many of the intersections that other STEM fields have with biology through the systems biology and the interdisciplinary approach that is key to ISB. Throughout our internship, we learned how creating impactful science may often require collaboration through systems thinking. Whether this be with biology lab scientists and data scientists, or with an educator and a student, collaboration is key to progress. A unique aspect of this internship was that it was held remotely: we and Vivek all met from different states (Illinois, Oregon, and Washington). Despite the distance and time differences, we were able to work together productively in order to learn, and also be part of an enjoyable experience and dynamic. Unlike previous experiences we have had as high school students, this internship introduced us to unique machine learning knowledge, exposing us to things like machine learning algorithms (DRonA and PRIME), coding, and data analysis. This sparked an interest that will, without a doubt, carry with us after we graduate high school, and beyond. Prior to this internship, we hadn’t worked with a research scientist as a mentor, and Vivek had never worked with high school students as interns. Throughout the eight weeks, it has been an invaluable learning experience for us all. We are so thankful for the patience, time, and effort Vivek put in towards helping them learn, and for the incredible opportunity that we were chosen to be a part of.
Acknowledgements
Thank you Vivek for your hard work and dedication to help us prosper throughout these eight weeks, and onwards! The time and attention to detail you spend when creating Google Collaboratories for us to reference are extremely helpful to our understanding. We appreciate all the extra resources you provide for us to expand our knowledge, your willingness and patience in answering any questions, and your helpful feedback in developing our presentation skills. We are truly thankful to have had you as our mentor. Additionally, thank you to the Baliga and Gibbons Labs for letting us intern this summer and broaden our learning with your presentations. And thank you to everyone else at ISB!
Please refer to the Acknowledgments page!
Shown below is a slideshow with the complete presentation:


