Abstract
Intern partners, Kalea Velasco-Cosare and Yannell Howard, along with mentors Ryan Roper and Jennifer Hadlock, in the Hadlock Lab worked on creating a Multi Comorbidity Respiratory Health SARS-CoV-2 Index over this past summer!
Introduction
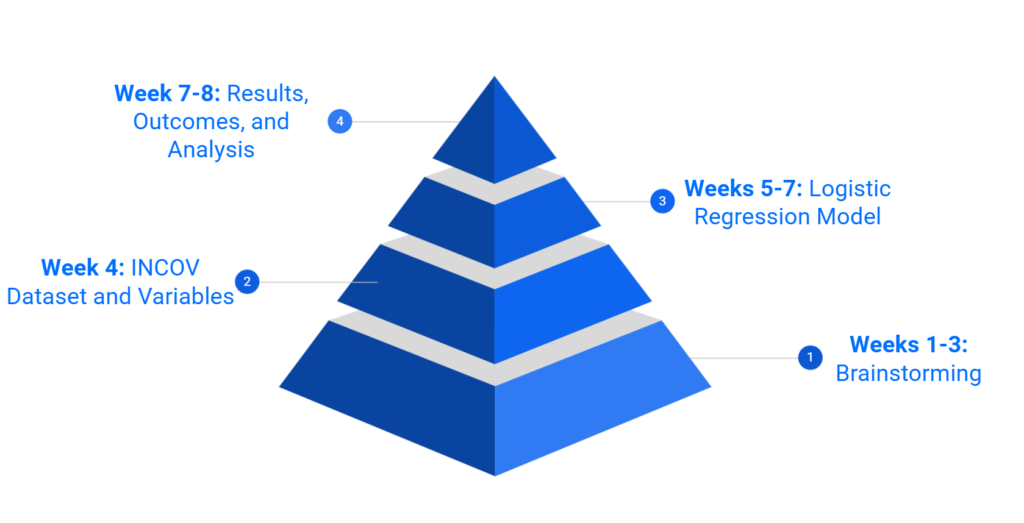
For the first three weeks, we spent much of our time brainstorming a project both of us would like to pursue that would also be an important question to research for the larger community and further serve an interest for the Hadlock Lab at ISB. This was the most intense part of our internship as we built a solid foundation for our project while being exposed to and learning new terms and concepts! We eventually decided on creating an index that assesses a person’s risk for a severe COVID-19 outcome resulting in death, if they were to get a positive test result for COVID-19 and had certain underlying comorbidities.
At first, we looked at analyzing specific diseases such as sickle cell anemia and behcet’s disease and creating a clinical concept around each disease such as a diagnosis flowchart. However, after reading the research paper Characteristics and Factors Associated with COVID-19 Infection, Hospitalization, and Mortality Across Race and Ethnicity – PubMed (nih.gov) of which both our mentors helped create, we were fascinated by the term Charlson Comorbidity Index (CCI). The Charlson Comorbidity Index is an index used to assess a person’s 10 year survival rate if they have certain comorbidities. The original version was published in 1987 by Dr.Mary Charlson and colleagues and is still used today. Inspired by the CCI, we decided to pursue something similar, however with adjustments to address the current times we live in including adding social demographics, patient information, and new morbid conditions such as SARS-CoV-2 to the variables of the index.
Implications
Since it’s hard to tell whether or not a variable is influential to a certain outcome, our project aimed to gather more information on influential COVID-19 clinical variables while providing a way to measure those influential variables simultaneously. The goal of our project is to provide patients and general everyday people a tool to assess their risk of dying from a severe COVID-19 outcome if they get COVID-19 and have underlying comorbidities at the same time. This will allow people to quantitatively gauge their risk further allowing them to analyze appropriate preventative measures they should take.
Methods
Once the groundwork was decided, we had to find a dataset that we would be able to use and run through our model, while also deciding what type of model to use. We ended up using a Logistic Regression Model.
A logistic regression model can be used to estimate the probability (a value between 0 and 1) of an outcome or event (such as patient death) based on one or more independent variables. Each model input has a coefficient that indicates the weight or significance of the variable in predicting the outcome and it can be either negative or positive.
Ryan Roper, MS. Data Scientist and our Mentor
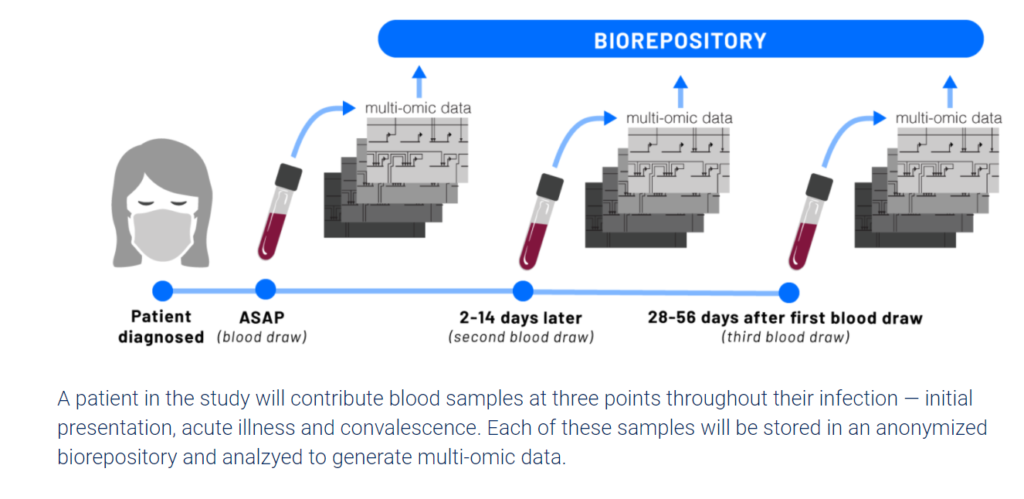
The Hadlock Lab works with Electronic Health Records (EHR) which has information on over 20,000,000 patients that require training to be able to work with. Due to time restraints, we instead used ISB’s INCOV dataset which has information on 212 patients that tested positive for COVID-19.
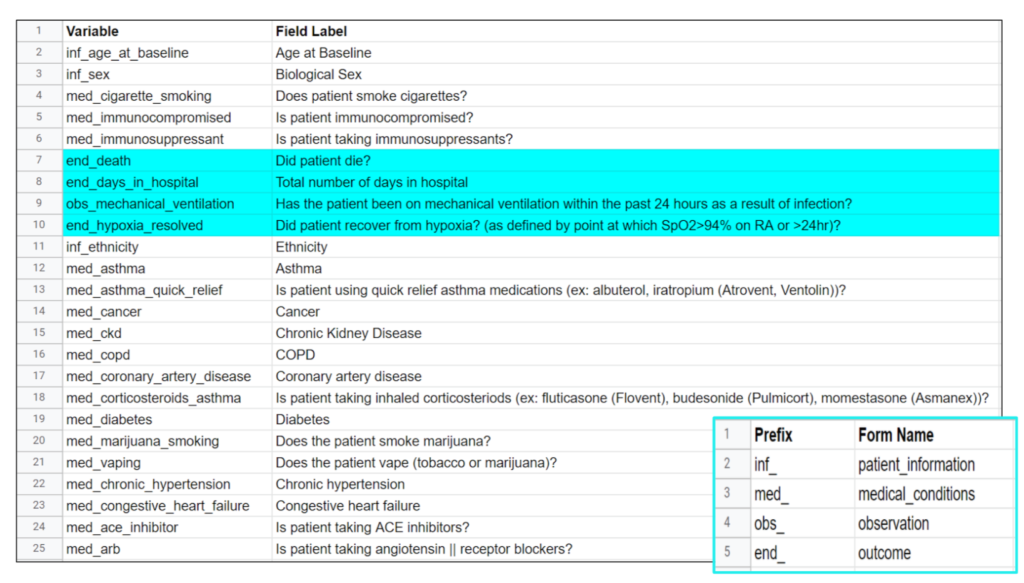
To decide what specific clinical variables and outcomes we wanted to look at, we had to narrow down what variables we included from the dataset. This meant looking for variables we thought would have a direct or indirect impact on a person’s COVID-19 outcome while also considering previous research on known influential clinical variables. We limited it down to 44 clinical variables from 196, however not all the variables had enough patient information or were recorded in a way that was unable to be used in a logistic regression model. In the end, we assessed 21 clinical variables and 4 outcomes including previously known influential COVID-19 clinical variables such as age, sex, ethnicity, and certain underlying comorbidities, and other clinical variables that affect body systems impacted by COVID-19 such as your respiratory, immune, and cardiovascular system. Unlike the scientific method, we didn’t start our project with a clear outcome we wanted to look at, so we ran four different logistic regression models to see what model generated more accurate results. We decided to look at death, days in hospital, mechanical ventilation, and hypoxia resolved as the outcomes for our models.
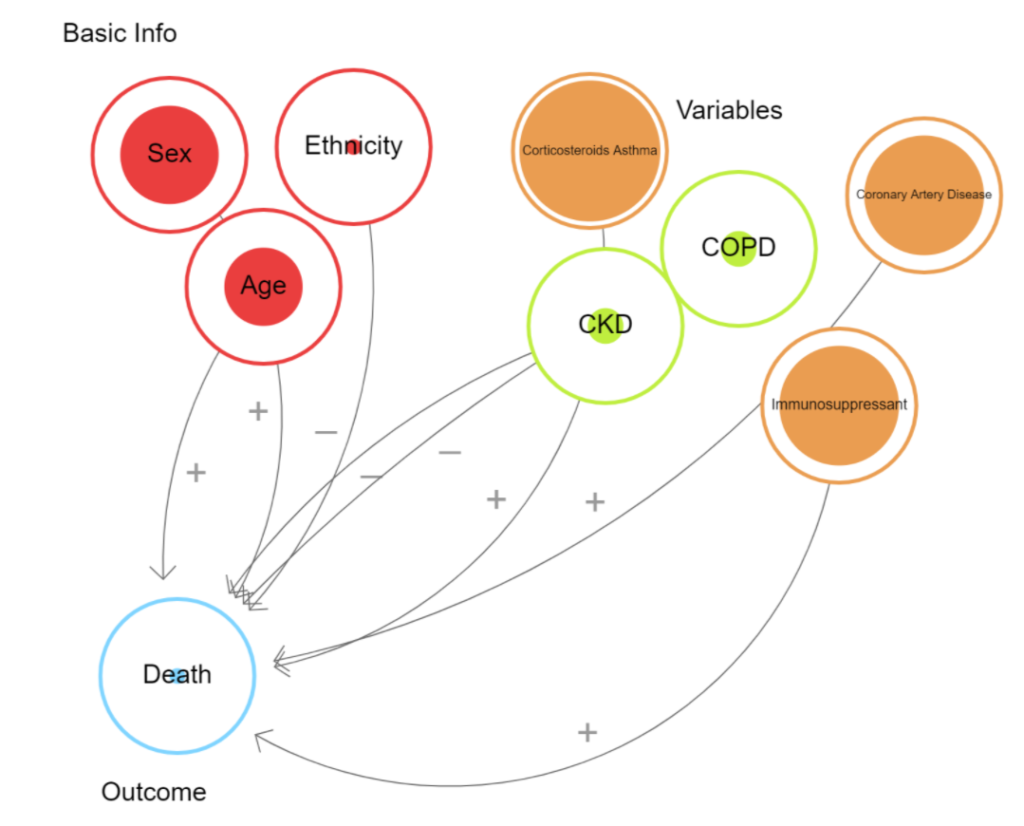
Shown to the right is a loopy model. Loopy is a program that is used to model the impact of variables on a certain outcome. The minus signs show variables that appeared to be less influential according to our model in comparison to the other variables. While the positive sign shows variables that appear to be more influential according to our model.
Results
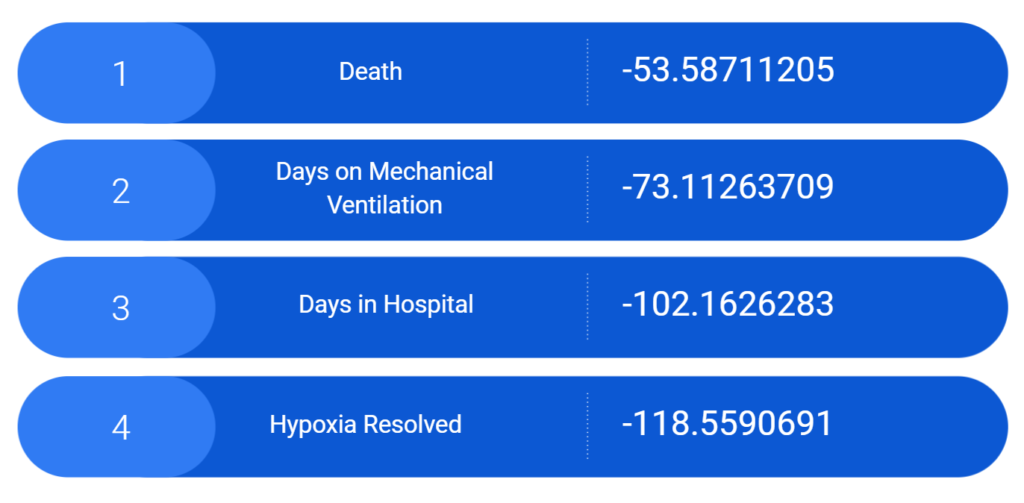
This shows the total error results for each of our four models. The total error is the collected score of the prediction error for all the variables in our model and provides a good ballpark figure regarding the relative accuracy of our models, or how well the model predicts the outcomes for this set of patients. Ideally, you would like your total error to be as close to zero as possible.
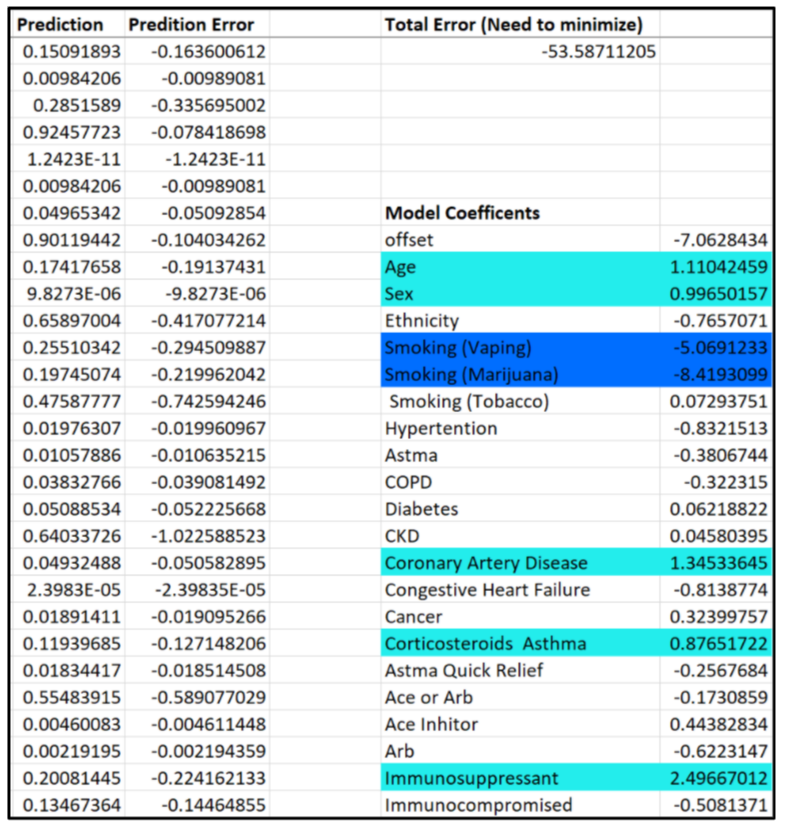
Since our death model turned out to be the most relatively accurate model in comparison to the others, we based our index off of that. For clinical variables to be deemed influential for an outcome, they have to have a positive coefficient model above 0.5 and below 2. To further explain our results:
A negative coefficient indicates an inverse relationship between the input variable and the model outcome, while a positive coefficient indicates a direct or positive relationship.
The magnitude of the coefficient generally indicates the strength of the association. However, the coefficients must be estimated using a dataset (known as a “training” dataset) in which the input variable values and the outcomes are known. The reliability of the estimated coefficients depends on the size of the training dataset. It is possible that a large negative or positive coefficient might not accurately reflect the actual strength of the association.
Ryan Roper, MS. Data Scientist and our Mentor
Analysis
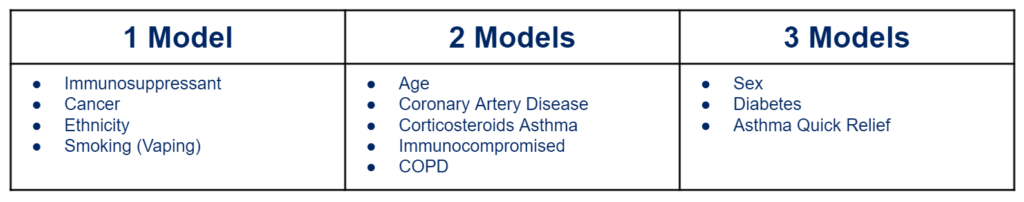
Out of the four models, 12 clinical variables turned out to be influential.
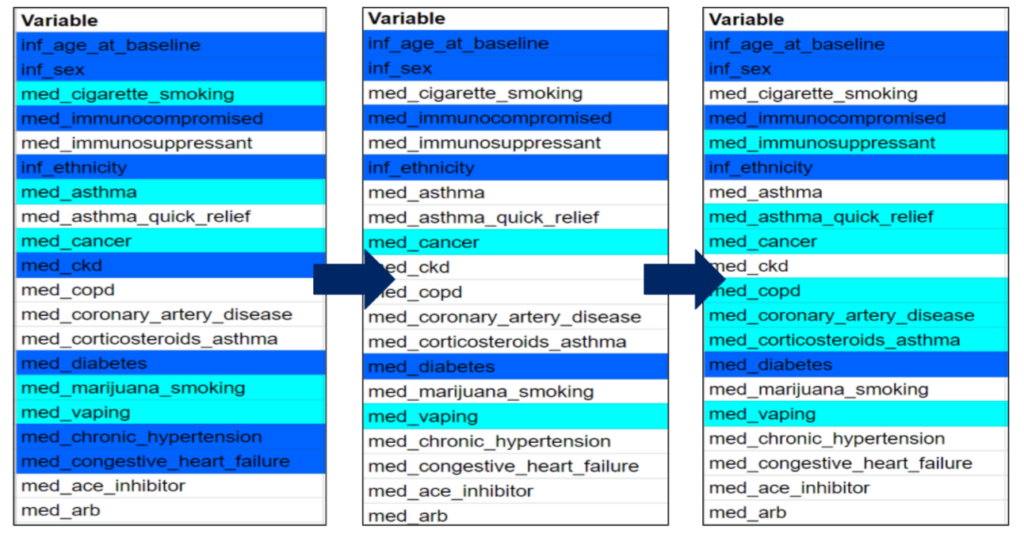
The first chart represents the clinical variables we expected to be important, the second chart are the actual clinical variables that appeared to be important from our expected results (first chart), and the last chart are all the clinical variables that appeared to be important in one model or more. Highlighted in azure are clinical variables that are known to affect your COVID-19 outcome from past research and highlighted in aqua are clinical variables we hypothesized could be influential due to their effects on the body and its systems.
Interesting results:
- Chronic Kidney Disease (affects excretory system), chronic hypertension (affects your respiratory system), and congestive heart failure (affects your cardiovascular system) are known underlying comorbidities that can increase your risk of a severe COVID-19 outcome, however they did not appear to be influential in any of our models
- Age is the biggest risk factor for a severe COVD-19 outcome, however only showed up as influential on 2 of our models, while sex (another known risk factor) shows up as influential in three of our models
- *This could be due to the fact that age was put into the logistic regression model on a different scaling system compared to the other variables affecting our model results
- Asthma does not show up to be influential in any of our models, however corticosteroids asthma and asthma quick relief (both asthma medications) show up to be influential on two or more models
- Cigarette smoking and marijuana smoking do not appear to be influential in our models, however vaping (which includes vaping either tobacco or marijuana) show up to be influential in at least one model
Index
Since death was our most accurate model, we based our index off of that.
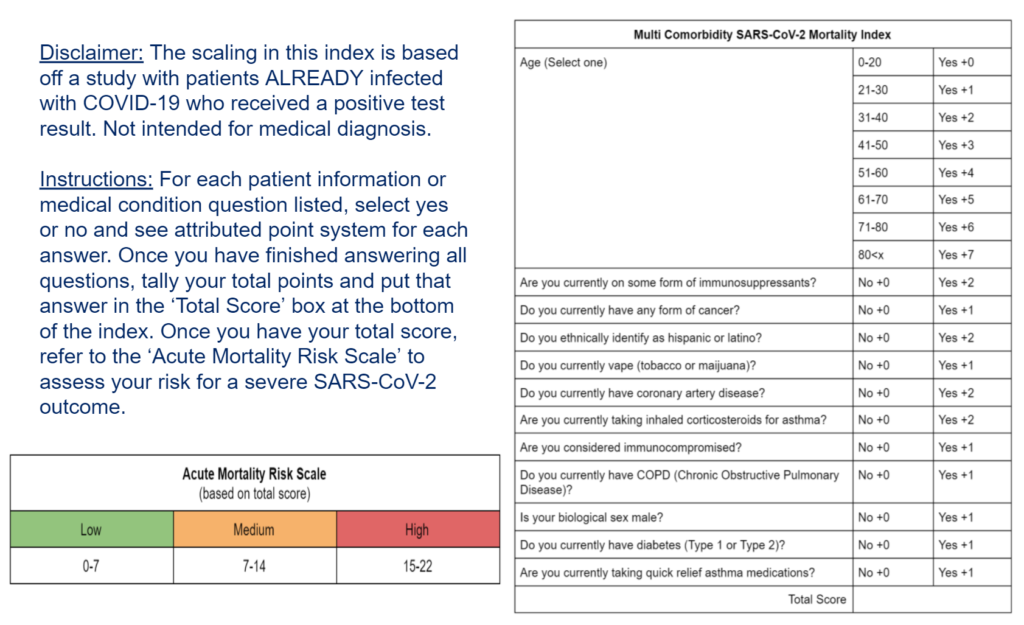
For this index, we took all the clinical variables that appeared to be influential in at least one model and created questions for each one. For the clinical variables that appeared to be influential on our death model, they got a score of +2 while the other clinical variables that were shown to be influential in at least one of the other models got a score of +1. Age is the only clinical variable that has a different scoring system depending on how old you are. We then took the highest total score a person could have and divided that into three groups to create our ‘Acute Mortality Risk Scale’ of low (0-7), medium (7-14), and high (15-22). However, to create an actual index (risk score) we would apply a different set of modeling processes, and then validate results.
Limitations
Like any science project, we had a lot of limitations, the biggest one being time because of the length of our internship. In the future, we would love to run a predictive analysis on the scoring for our index, make it more accessible and interactive, and write explanations for each question and person’s score. In addition, because the INCOV dataset is a small cohort, with limited variables and lots of missing data affecting our model results, we would love to run the logistic regression model through the EHR dataset and compare results regarding our INCOV model accuracy and influential variables. We would also like to add variables outside of the INCOV dataset such as social demographics, social disparities, and other comorbidities such as sickle cell anemia and behcet’s disease. Lastly, while ISB has extensive cloud-based tools that enable modeling, we used Excel because it allowed us to learn more about what goes into a logistic regression model and focus on the scientific design and results, rather than spending the internship on new platforms and coding languages. However, because we used Excel, we had to implement equations by scratch and we ran out of time to implement the confidence intervals (a range in which the “true” coefficient value is likely to be found) and p-value (a measure of how likely a coefficient value could occur by random chance) equations. Instead, we ran multiple models which provided a level of confidence about which variables were the most influential In the future, we would like to run the logistic regression model on other platforms and generate confidence intervals and p-values for our model.
Conclusion
We learned a lot from our project such as the downsides of data science and machine learning, the scientific research process, and clinical concepts to name a few.
We are excited to see the further development we or other interns may take on this project in the future and the possible implications it can have on the larger community.
We would like to give the biggest acknowledgements to our amazing mentors Jennifer Hadlock and Ryan Roper for their amazing support throughout this internship and the rest of the Hadlock Lab, SEE team, and our intern cohort, our project would not have been possible without you guys!
Please refer to the Acknowledgments page!
If you have any questions or would like to get more information on this project and our results, please feel free to reach out to either Kalea at kaleavc@gmail.com or Yannell at yannellhoward1@gmail.com.
Feel free to check out our entire presentation slideshow below:


