Background
The intersection between computer science and biology is becoming more influential everyday. Computers and coding allow for biologists to quickly process and analyze huge amounts of data. Computational biology plays an important role in the analysis of transcriptomics. Transcriptomics is a key tool of analysis in biological research because it allows scientists to see the differences in gene expression between different conditions. In this project we gained skills in computational biology through the analysis of transcriptomics.
Raspberry Pi and Python
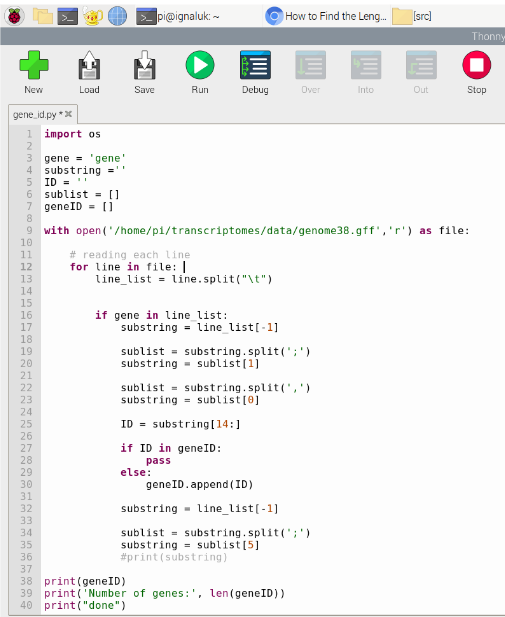
The first tool we used to learn computational biology was the Raspberry Pi microcomputer. Although it didn’t look very powerful, we realized that it had a lot of the functions that a regular computer has. On the Raspberry Pi, we learned how to use the Linux terminal to create organized directories which store files of code and data. We researched basic syntax of Python and created simple scripts. We used python to explore the human genome annotation file, writing code to count the amount of genes and list their biotypes. The hands-on work with Python created a foundation that helped us understand data visualization and analysis with code.
Researching
A large part of our internship was discussing and researching weekly self-assessment questions given to us by Adrian. These helped us develop knowledge on our own and built a foundation for the practices and exercises we completed later in the summer. We did not understand the significance of transcriptomics at first and, with the help of the guiding questions, we developed our understanding by researching. We soon fell into a system of reading and discussing articles and scientific papers he gave us, doing additional research on our own, and then answering the questions to the best of our ability. This was a great way to become more independent while also having Adrian available to answer any questions we had left.
Data Visualizations
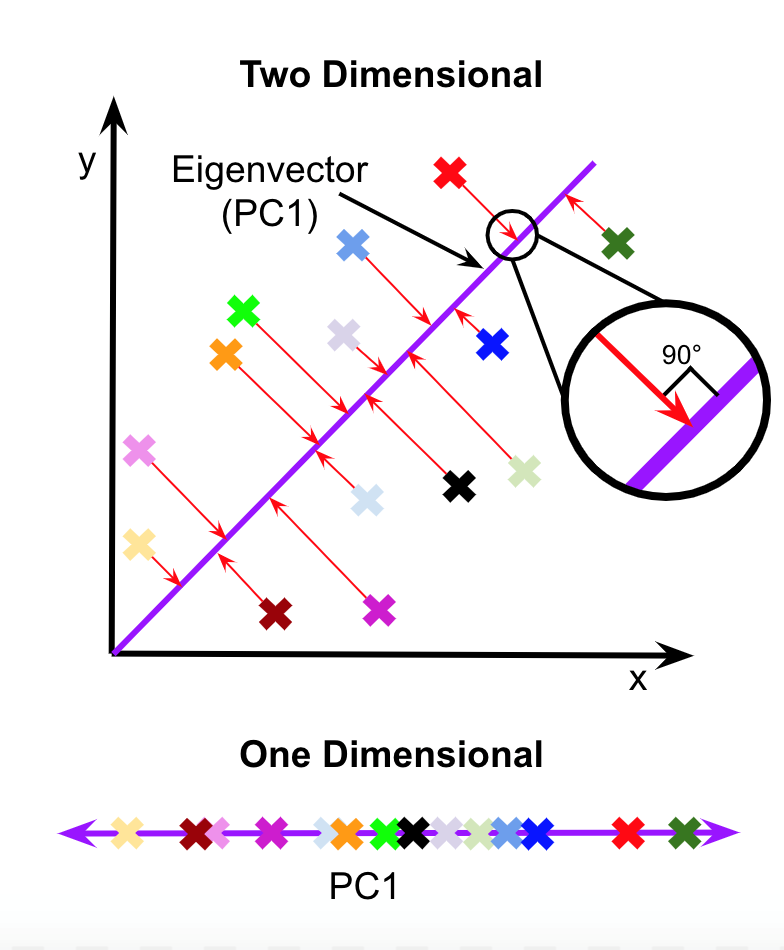
To understand the role of computational biology in research, we learned about data processing and visualization. We ran through the Google Colab Notebooks provided by the Krishnaswamy Lab for their Machine Learning workshop. In this workshop, we worked with single cell RNA sequencing data to understand its structure and applications in the real world. We ran through data preprocessing techniques such as normalization, filtering, and imputation. Different clustering algorithms, such as kernel clustering, k-nearest neighbors, k-means, spectral, and Louvain clustering, were also covered. Another topic we studied was dimensionality reduction, both linear and nonlinear. We learned about PCA, t-SNE, UMAP, and PHATE. By visualizing the same dataset using different clustering and dimensionality reduction techniques, we were able to see the advantages and disadvantages of each method. In the workshop we were introduced to Python libraries such as pandas, numpy, and matplotlib, which are used for data analysis.
Scientific Article
After reading several scientific papers and researching the process of writing one, we decided that a paper would be the best way to present our learning. We also decided to submit our article to JOURNYS and the National High School Journal of Science, two science journals for high school authors. In order to comply with their guidelines we needed a specific topic, so we chose data visualization and dimensionality reduction. It is important for high schoolers to be informed about this because data science is an upcoming field that can be used everywhere. But while researching dimensionality reduction, we found that most of the articles were very technical and we struggled with fully grasping the concept. We wanted to create a resource that is more accessible and understandable to high school students. The article is titled The Art of Data Science: Visualization, and it covers the importance of data science and visualization, dimensionality, linear and nonlinear dimensionality reduction, and data processing. Due to our desire to publish, we are unable to show our full article, but you can find the abstract here.
Acknowledgements
We would like to thank the SEE program, Claudia Ludwig, Rachel Calder, and Becky Howsmon for the learning opportunity and support; Adrian Lopez Garcia de Lomana and Nitin S. Baliga for the mentorship; scientists and employees of ISB for allowing us to learn by interviewing them; and the other interns for the fun and support.