By Vasu Shandar
Abstract:
Prevotella copri is a bacterium of high interest in the human gut microbiome because of its association with long-term diet patterns and host health. The intent of my internship was to gain a deeper understanding of comparative genomics in Prevotella by the analysis of a single sample. Through the anvio software interface and pandas I was able to observe clustering patterns between various P. copri samples and their divergent functions based on geographical location. Using the ANI index and a functional heat map I made preliminary hypotheses concerning the gene expression differences observed between samples and potential associations with lifestyle.
Background:
In recent years gut microbiome health has become an increasingly recognized factor in our overall wellness as humans. Our microbiomes can influence almost all the systems in our body which is why it is important to understand the impact of the various inhabitant bacteria and their abundances on our own microbiomes. One recent bacterium of interest has been Prevotella. Until 1990, Prevotella was undistinguished as an independent genus, instead conflated with the Bacteroides genus because of their high similarity. Since then, over 50 Prevotella species have been identified with Prevotella copri being the species most prevalent in the human gut microbiome. Multiple studies have reached the conclusion that Prevotella and Bacteroides have an observed tradeoff in abundances between each other. Prevotella has a greater prevalence in non-Western diets heavier in fiber while Bacteroides is more common in Western lifestyles. The sample used in my internship was taken from an obese teenager in Washington and the intent was to compare our sample to samples from around the globe.
The Species Concept:
Defining species can be a controversial subject because of the variety of valid methods to differentiate them. One measure of defining species is the average nucleotide identity (ANI) index which in one paper has distinguished ANIs > 95% as the same species and ANIs < 85% different species. Based on a paper by Ruth Ley, Prevotella copri has been distinguished into 4 clades but not into further species. Part of my project will be calculating the ANI indexes for different Prevotella samples to see if they should be classified into the same or different species.
Methods:
- Our sample was quality trimmed with FASTP and assembled with MEGAHIT
- Taxonomy was assigned using Centrifuge
- The singular and pangenome (9 other samples) was visualized with Anvi’o by Meren Lab
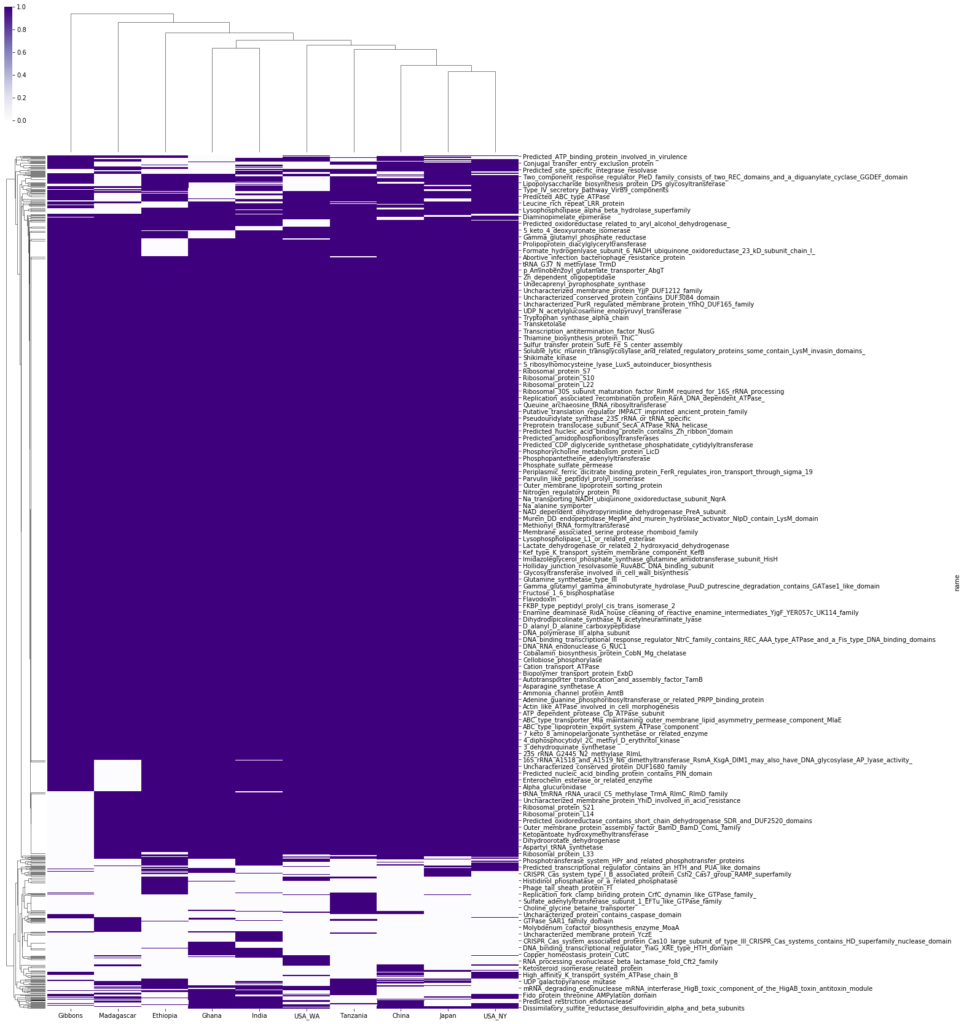
- Anvi’o generated the ANI index and enriched gene function occurrence table which was visualized using seaborn in pandas
Singular Genome:

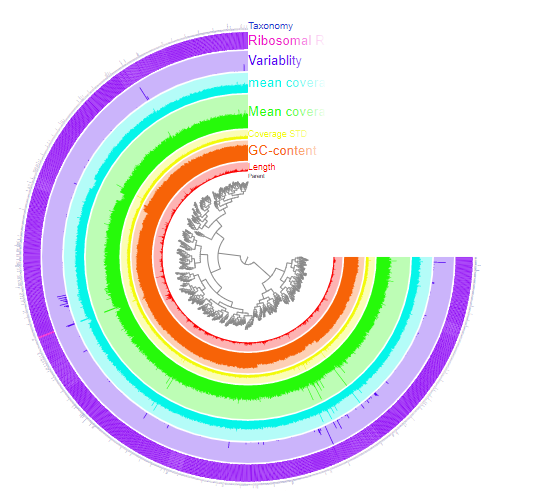
Our sample had a mean coverage of about 5-10x and an N50 of 1446 base pairs. This means our contigs were of sufficient length (the baseline N50 is 1000 base pairs) and they all replicated more than 5 times. Our core gene completion was 70.42% and the redundancy (a measure of contamination) was under 5% (4.2%) which is the upper threshold for a clean sample. These statistics meant our sample was well trimmed and accurate enough for us to proceed to the pangenome analysis.
Pangenome Analysis:

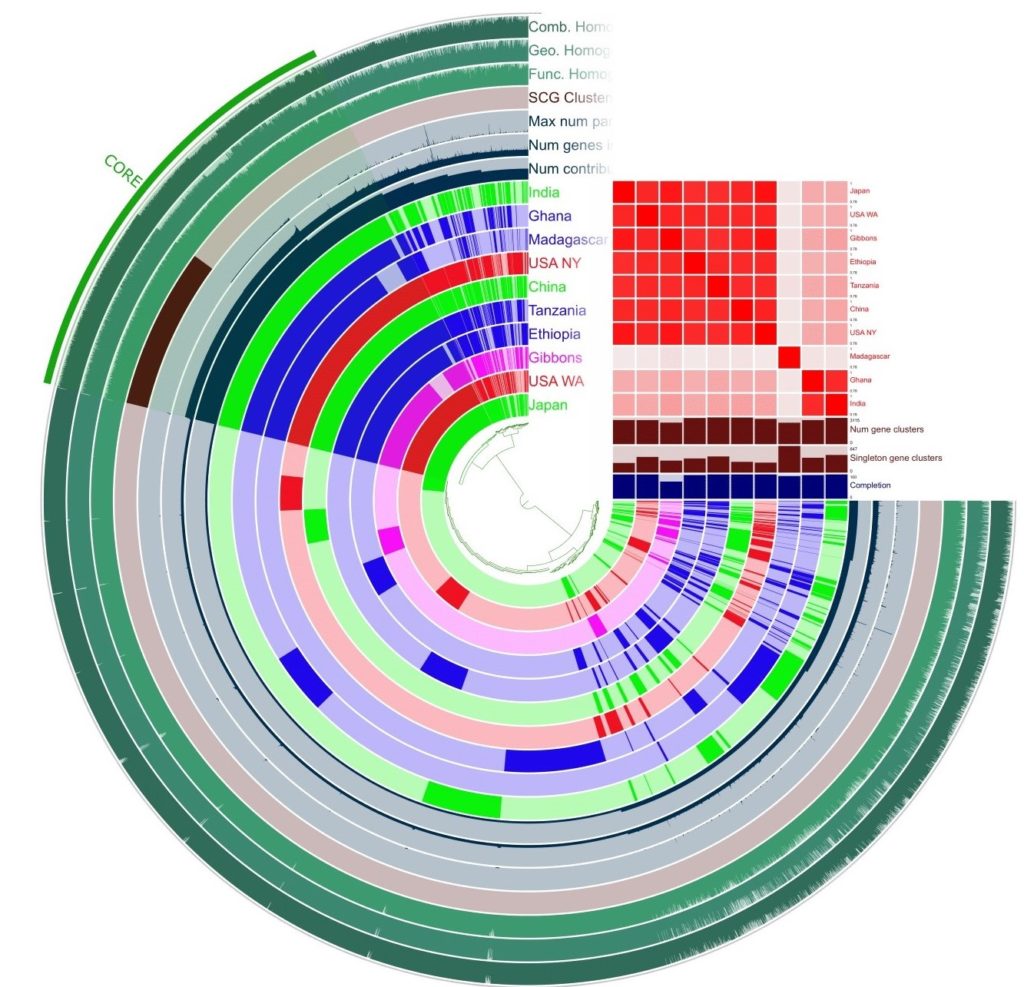
Our samples show homogeneity in the core gene region, indicating that there are highly conserved regions across the Prevotella copri species. However, the accessory gene region shows high variation with many samples having unique functions or shared functions only within a cluster. The pangenome analysis generated the ANI index table and a table of enriched functions across the samples.
ANI Index:

There are a few key highlights from the ANI index table. First, our sample is highly similar to the sample from USA New York and the sample from Japan. Most countries following a more Westernized diet have clustered together. Madagascar is a major outlier, with low similarity to all other samples. Ghana and India have high similarity to each other but under 86% to all the other samples. The African samples are the most stratified in clustering with Ethiopia and Tanzania falling closer to the Westernized group, Ghana only clustering with India, and Madagascar being a complete outlier. The next step is to use the enriched functions table to try and understand what genes may be expressed causing the clustering noticed in this table.
Functional Analysis:

Included here are the 5 unique functions from the analysis of enriched genes in just our sample.
Creatinine: A waste product from breaking down creatine, a recycler of ADP. May be a health promoting function.
Glycine cleavage: Initialized when glycine concentration is high, usually observed in healthy microbiomes.
Arsenite pump: homologous gene coding for arsenite resistance, may be a result of ingested substances by host.
DNA ligase: Gene initialized during DNA replication suggesting health of host if replicating P. copri.
Sulfurtransferase: Enzyme in response to sulfur in the gut environment. Effect of sulfur on the microbiome is still in study.
Conclusions:
- The pangenome analysis shows our sample to be highly similar to the USA_NY and Japan samples, corroborated by the ANI index. This is likely correlated to Westernized diet patterns that are also noticed in China and USA_WA. The African samples were more stratified with Tanzania and Ethiopia falling into groupings with Western samples, Madagascar being an outlier, and India and Ghana clustering together.
- Though Prevotella has a highly conserved core gene region, there is wide variation in the accessory genes and their function.
- The ANI index supports the hypothesis that Prevotella copri could be considered multiple species because the ANI between certain samples fall under the 85% threshold for a species.
Future Directions:
- Looking further at functional differences between gene clusters
- Trying to correlate differences noticed in functional gene analysis with metadata from samples
- Conducting a more holistic pangenome analysis (multiple samples per country/region) to ascertain Prevotella genes specific to geographic location
- Looking for correlations between function and abundance (population density)
Acknowledgements:
I want to thank the SEE education program including Rachel Calder, Claudia Ludwig, and Becky Howsman for their support and encouragement throughout this internship. I’m extremely thankful to Dr. Christian Diener for his mentorship and Dr. Sean Gibbons for this opportunity and continued support. This internship was an invaluable experience that I’ll carry with me for the rest of my life. This work was supported by a Washington Research Foundation Distinguished Investigator Award.
