Brooke Ury and Myles Vinh Farr
Goal
In this project, our goal was to subtype melanoma using genome-wide expression analysis.
Background
Melanoma is a type of skin cancer generally caused by a combination of factors, including UV exposure and genetics. The number of cases per year continues to grow, with more than 200,000 cases expected next year for the US alone. It is considered the most serious type of skin cancer due to its ease in metastasizing (spreading to other organs and parts of the body). However, cancers are a buildup of mutations, so not all patients of melanoma will have the same molecular profiles. In this analysis, we attempted to subtype melanoma by creating gene regulatory networks using MINER, a python program developed at ISB.
We used data from the GDC (Genomic Data Commons), a part of the NIH, the National Institute for Health. Specifically, it came from the project TCGA-SKCM (the cancer genome atlas, for skin cutaneous melanoma). The data came in the form of FPKM values, which stands for fragments per kilobase millions. It is a measure of how many mRNA sequences there are per gene, which is normalized for gene length and the depth of the experiment.
Processing Data
The raw data involved 470 patients, with approximately 60,000 FPKM values per patient, as there were around 60,000 genes to account for. However, the majority of the FPKM values were zero. Humans have thousands of genes, but all cells are not going to express all those genes. After all, genes for smelling would not be expressed in a red blood cell. Our goal was to find the genes whose FPKM values had large variation, and that were generally greater than 1. Ideally, we only wanted to analyze genes that were being expressed in patients, and that were being expressed in different ways (if all melanoma patients had an FPKM value of 10 for a certain gene, it would not help us to determine different types of melanoma). We tried multiple methods to process the data, including coefficient of variation, entropy, and a filtering method. Ultimately, we decided to eliminate a gene from out analysis if less than 30% of the FPKM values for that gene were above 3.
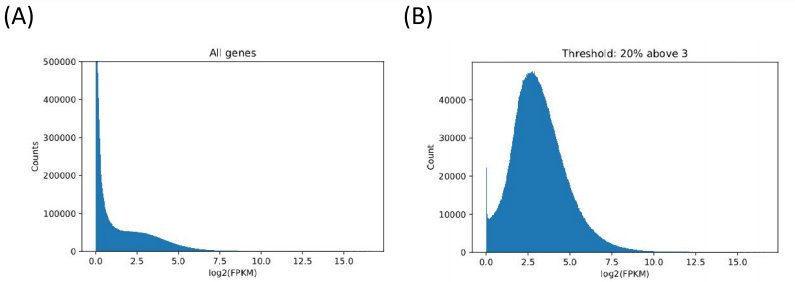
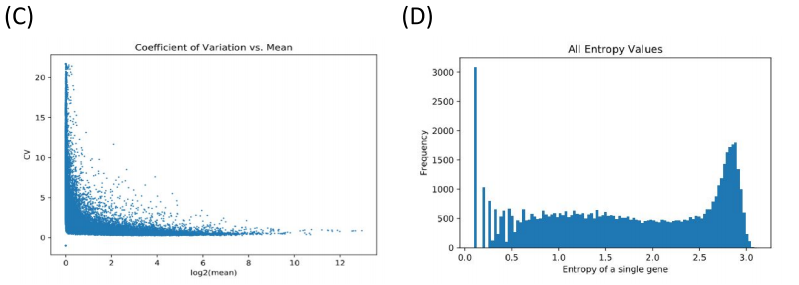
Figure 1. Filtering and refining. (A) The raw data (with many zeros). (B) Data post-filtering using a minimum FPKM threshold. (C) (D) Alternate attempts at filtering (coefficient of variation and information entropy). CV failed because more expressed genes had lower variation. Entropy failed because there was a lot of noise making it hard to set an arbitrary threshold.
Clustering
After we processed the data, we used MINER to cluster the genes. Groups of genes are clustered together if they are coexpressed, meaning that the overexpression and underexpression patterns of genes is similar between patients.
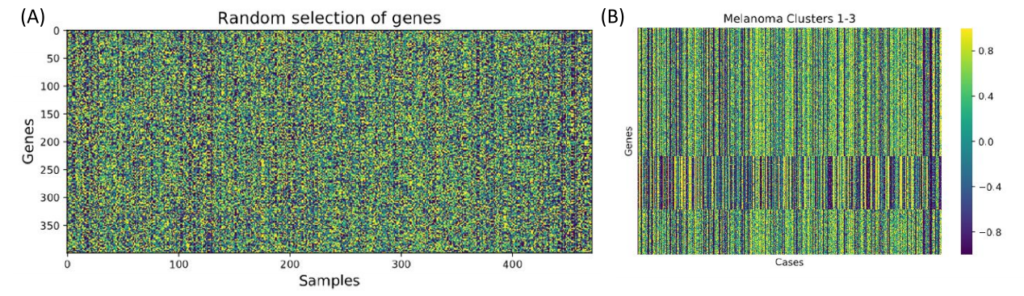
Figure 2. Clustering using PCA and K-means. (A) A random selection of genes before clustering. (B) The first three clusters showing how a group of genes in a cluster are coexpressed.
Network mapping/ mechanistic inference
After the initial clusters were created, they were compared to known regulons from a database. The database includes information about both the regulon and the genes controlled by the regulon. If the genes from the cluster matched to the genes controlled by the regulon, then the genes were kept and associated to the regulon. Additionally, each regulon per patient was assigned one of three values: 1 if the regulon is upregulated, -1 if the regulon is downregulated or 0 if the regulon was approximately average.
Figure 3. Network Activity. The coexpression clusters were then compared to known transcription factor-gene interactions to create coregulation clusters (regulons). Next, regulons for each patient were assigned one of three values: 1 (red/upregulated), -1 (blue/ downregulated), or 0 (white/null).
Subtype discovery
After regulons were discovered, the next step using MINER was to create subtypes based on the data. First, patients were compared to each other to create initial clusters of similarity. Then, from those initial clusters, MINER compared them to known transcriptional programs. MINER determined which transcriptional programs regulation changed significantly between initial clusters, creating more refined subtypes.
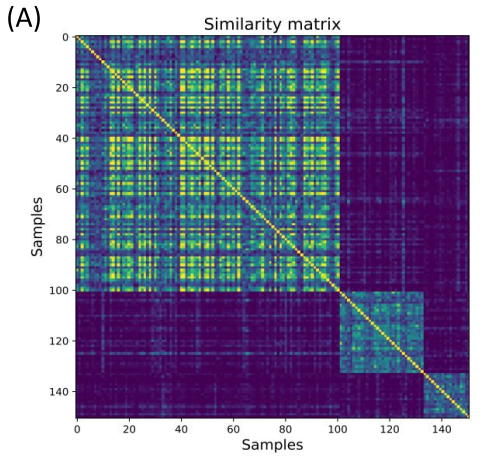
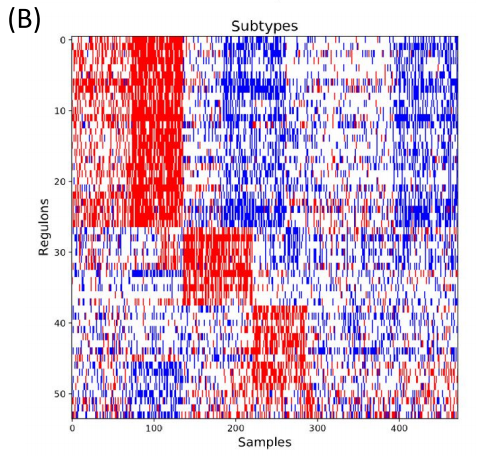
Figure 4. Disease subtypes and survival through patient similarity. (A) Initial patient groups formed by comparing patients’ molecular profiles. (B) Final subtype form showing how there are clusters of regulons (programs) and how patients group together through these transcriptional programs.
Survival by Subtype
After the subtypes of melanoma were determined, we went away from MINER and created our own code to determine the survivability of each of the eight subtypes of melanoma. We used a Kaplan-Meier estimate to determine the survivability, which is essentially a ratio of alive patients to dead patients at each moment in time.
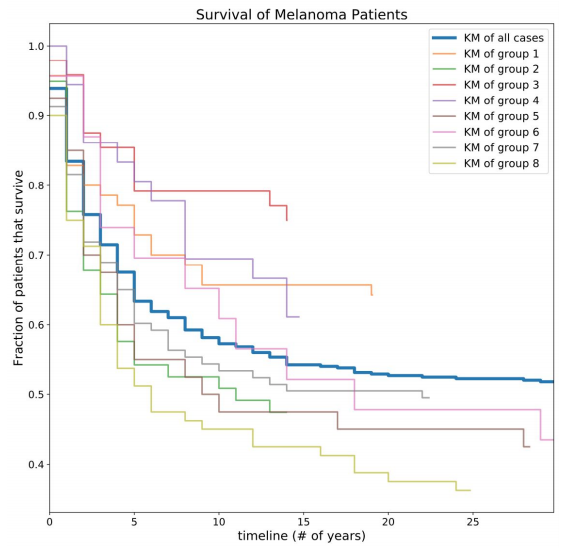
Figure 5. Survival of Melanoma patients by subtype. Risk estimations calculated by creating Kaplan-Meier curves for subgroups. Notably, certain groups are much more/less at risk than the population as a whole (blue line).
Results
Although some of the subgroups had what appeared to be very similar molecular profiles, the survivability of these groups were actually quite different. For example, subgroups 1 and 2 seem very similar at first glance, but one of the subgroup’s survival curve was much higher than the average for all the patients, and the other subgroup was much smaller.
Future Directions
In the future, we hope to more extensively study the gene regulatory network from a biology standpoint. We want to understand why specific mutations in certain genes caused the differences in survival.
Check out our github here: https://github.com/isbinternship/MelanomaExpression/tree/master
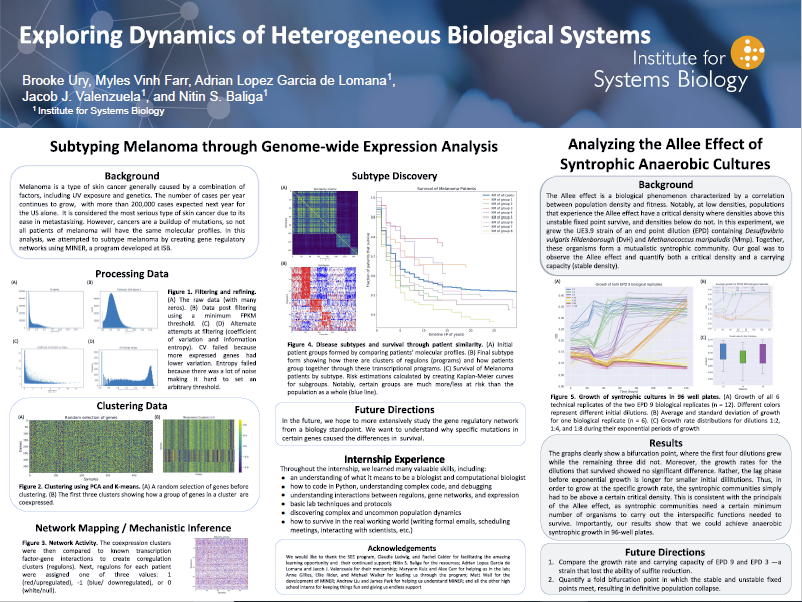
Figure 6. Brooke and Myles with their completed poster.
Acknowledgments
We would like to thank the SEE program, Claudia Ludwig, and Rachel Calder for facilitating the amazing learning opportunity and their continued support; Nitin S. Baliga for the resources; Adrian Lopez Garcia de Lomana and Jacob J. Valenzuela for their mentorship; Maryann Ruiz and Alex Carr for helping us in the lab; Anne Gillies, Ellie Rider, and Michael Walker for leading us through the program; Matt Wall for the development of MINER; Andrew Liu and James Park for helping us understand MINER; and all the other high school interns for keeping things fun and giving us endless support