|
Intro
For this experiment, we studied how diatoms grow in varying nutrient and light conditions. Diatoms are eukaryotic phytoplankton that play a large role in the global carbon cycle and ocean ecosystems and form the base of food webs in coastal and upwelling systems. Each spring, when nutrient levels, light levels, and temperatures are high, diatom populations soar across the world causing blooms. During these blooms, increased photosynthesis leads diatoms to sequester huge amounts of CO2.
CO2 levels have risen dramatically since the industrial revolution and blooms play an important role in sequestering atmospheric that CO2, but little is known about the specific mechanisms of these blooms, and how their ability to sequester CO2 will change as atmospheric levels continue to rise. Thus, it’s important for us to understand how diatoms bloom and what sort of conditions are required for their growth, in order for us to make accurate predictions about the future of the global carbon cycle and climate.
Diatoms also rely on Nitrogen and Phosphorus for their growth, and thus play a role in oceanic nitrogen and phosphorus cycles. Nitrogen is required to make amino acids – the building blocks of proteins. Phosphorus is required for DNA, while they use silica to make their glass shells. Samples of marine phytoplankton communities have shown that Nitrogen, Phosphorus and Silica exist in the ratio N:P:Si::16:1:15.
Procedure
Day 1: Pouring media, inoculating cultures, taking first measurements.
We grew our diatoms in four different types of media to see how the depletion of certain nutrients would affect the diatoms’ growth:
- All Nutrients: This media contains three necessary nutrients, nitrogen (N), phosphorus (P), and silica (Si) in excess, meaning the diatoms won’t run out.
- N-: This media is limiting with regard to nitrogen, meaning all the other nutrients (Si and P) will be present in excess, but N is present at a level similar to what is found in real ocean ecosystems.
- P -: This media is limiting with regard to phosphorus.
- Si-: This media is limiting with regard to silica.
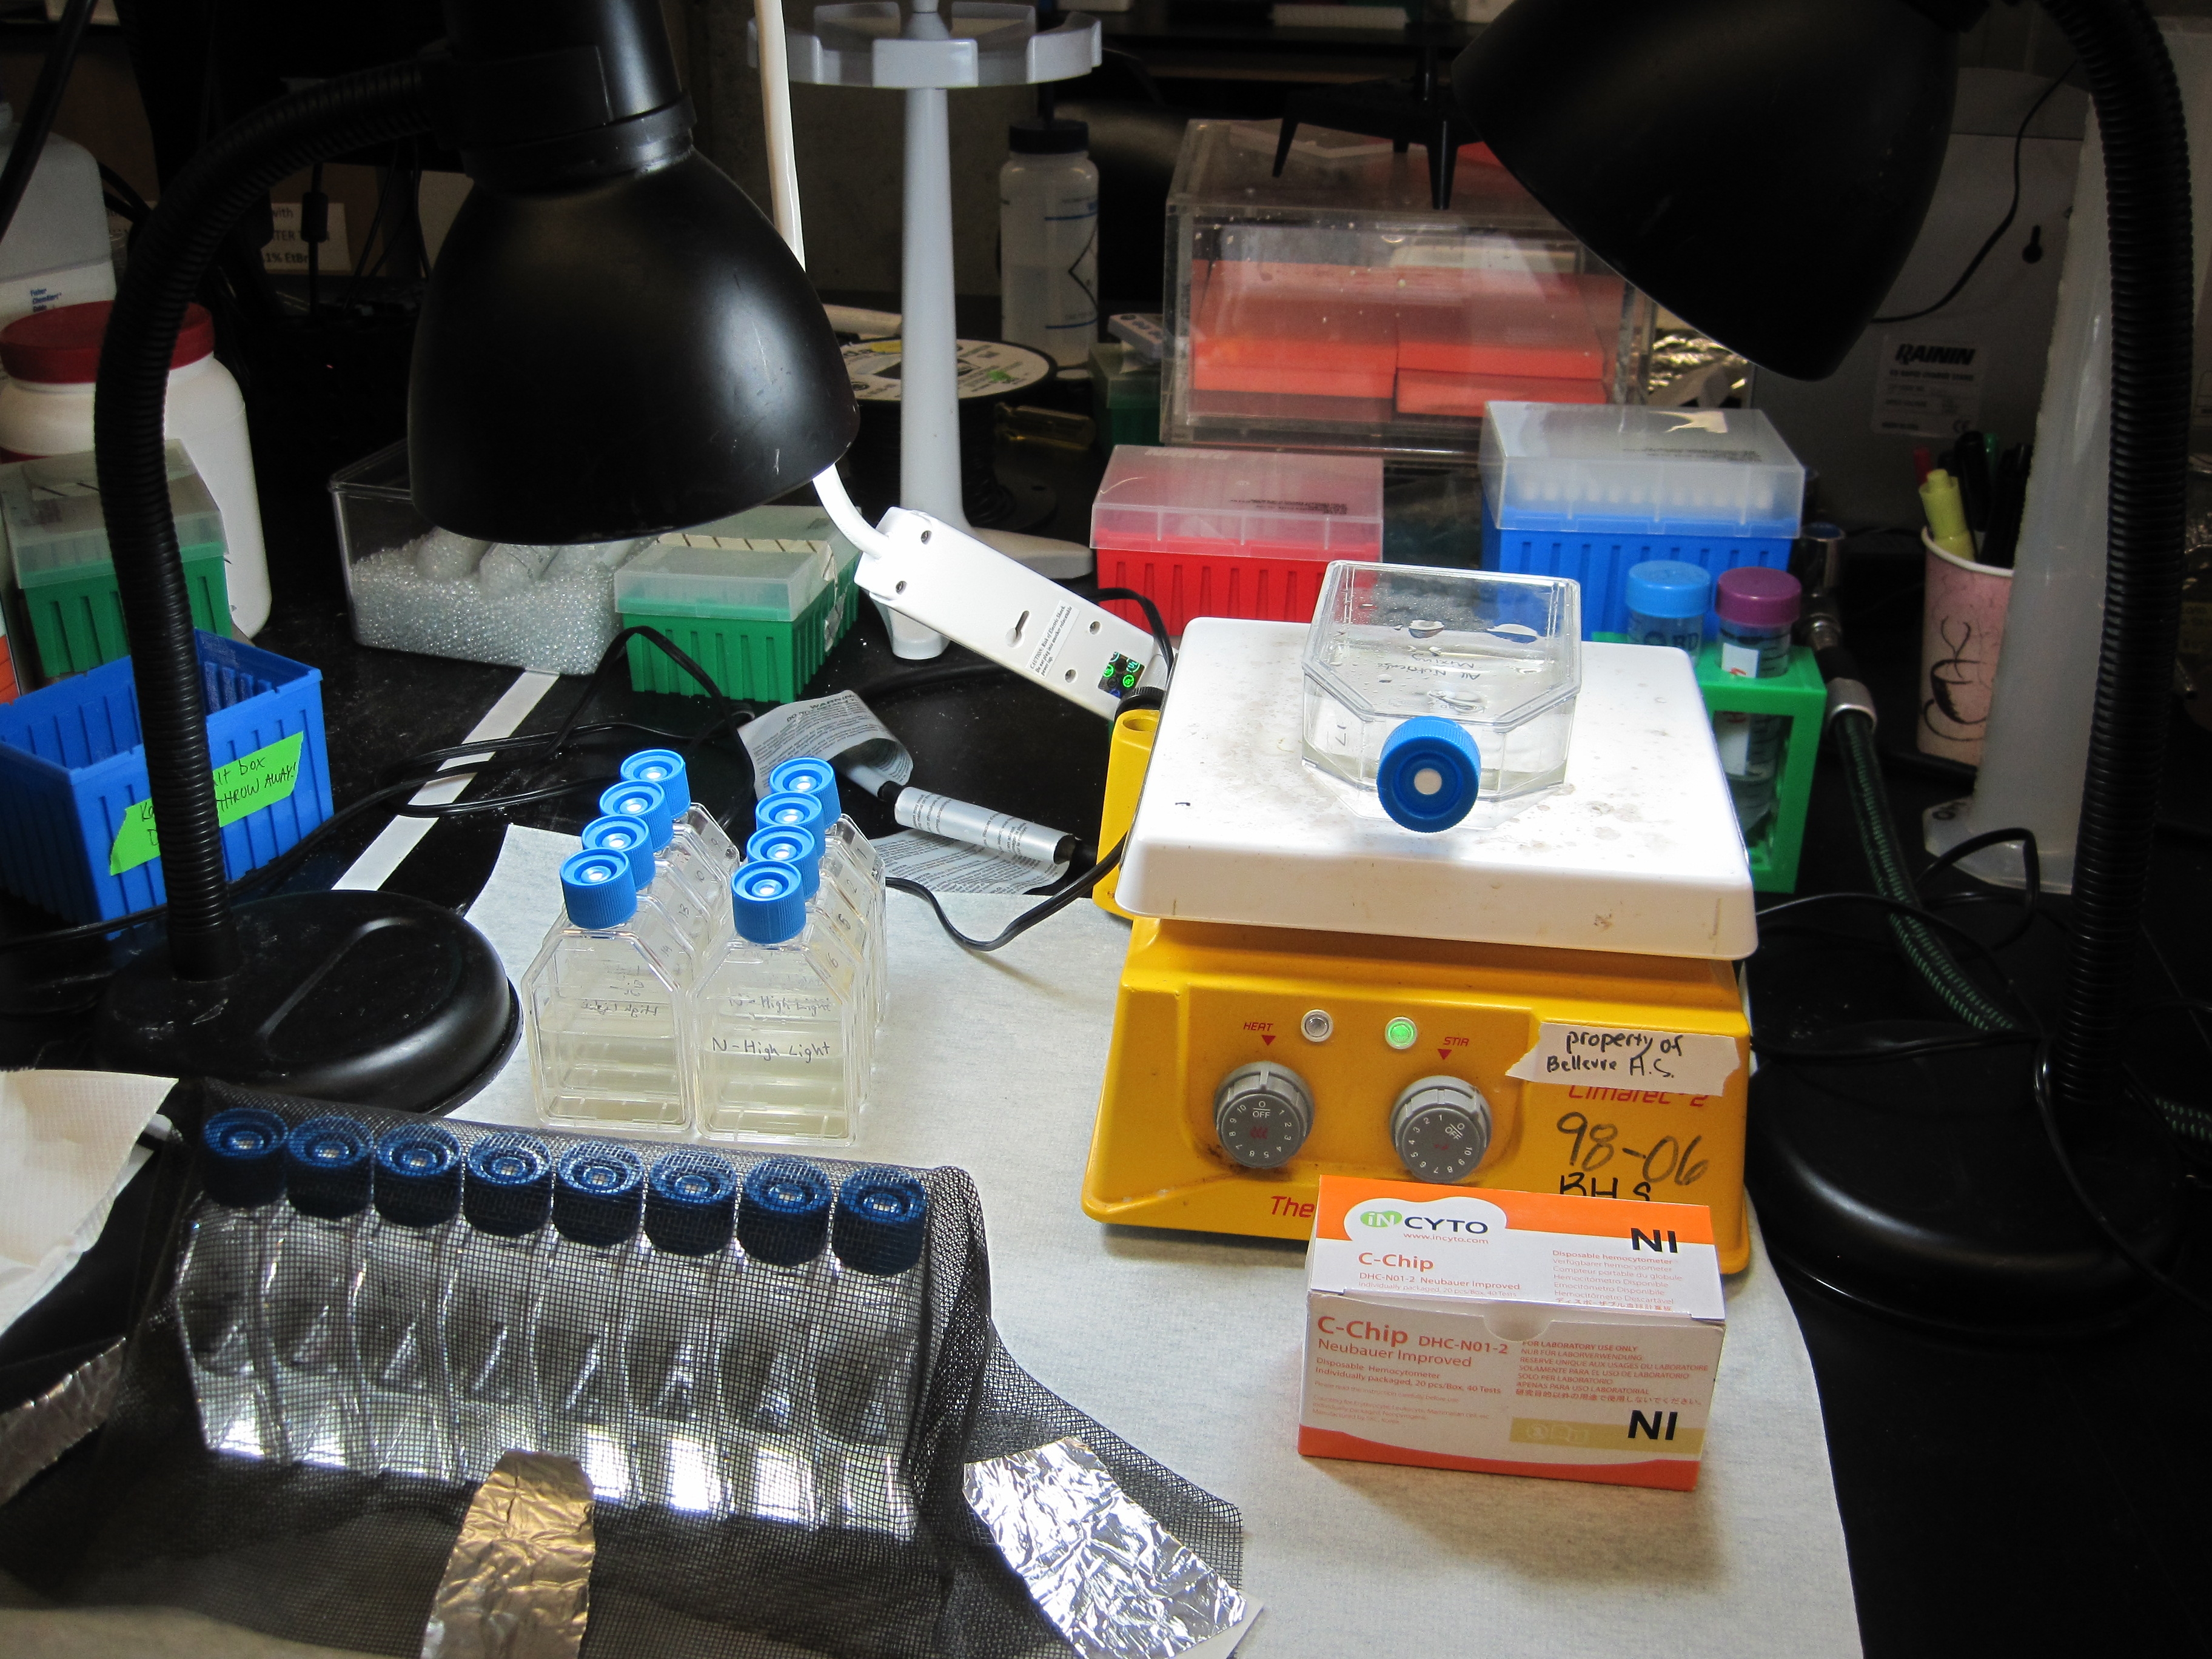
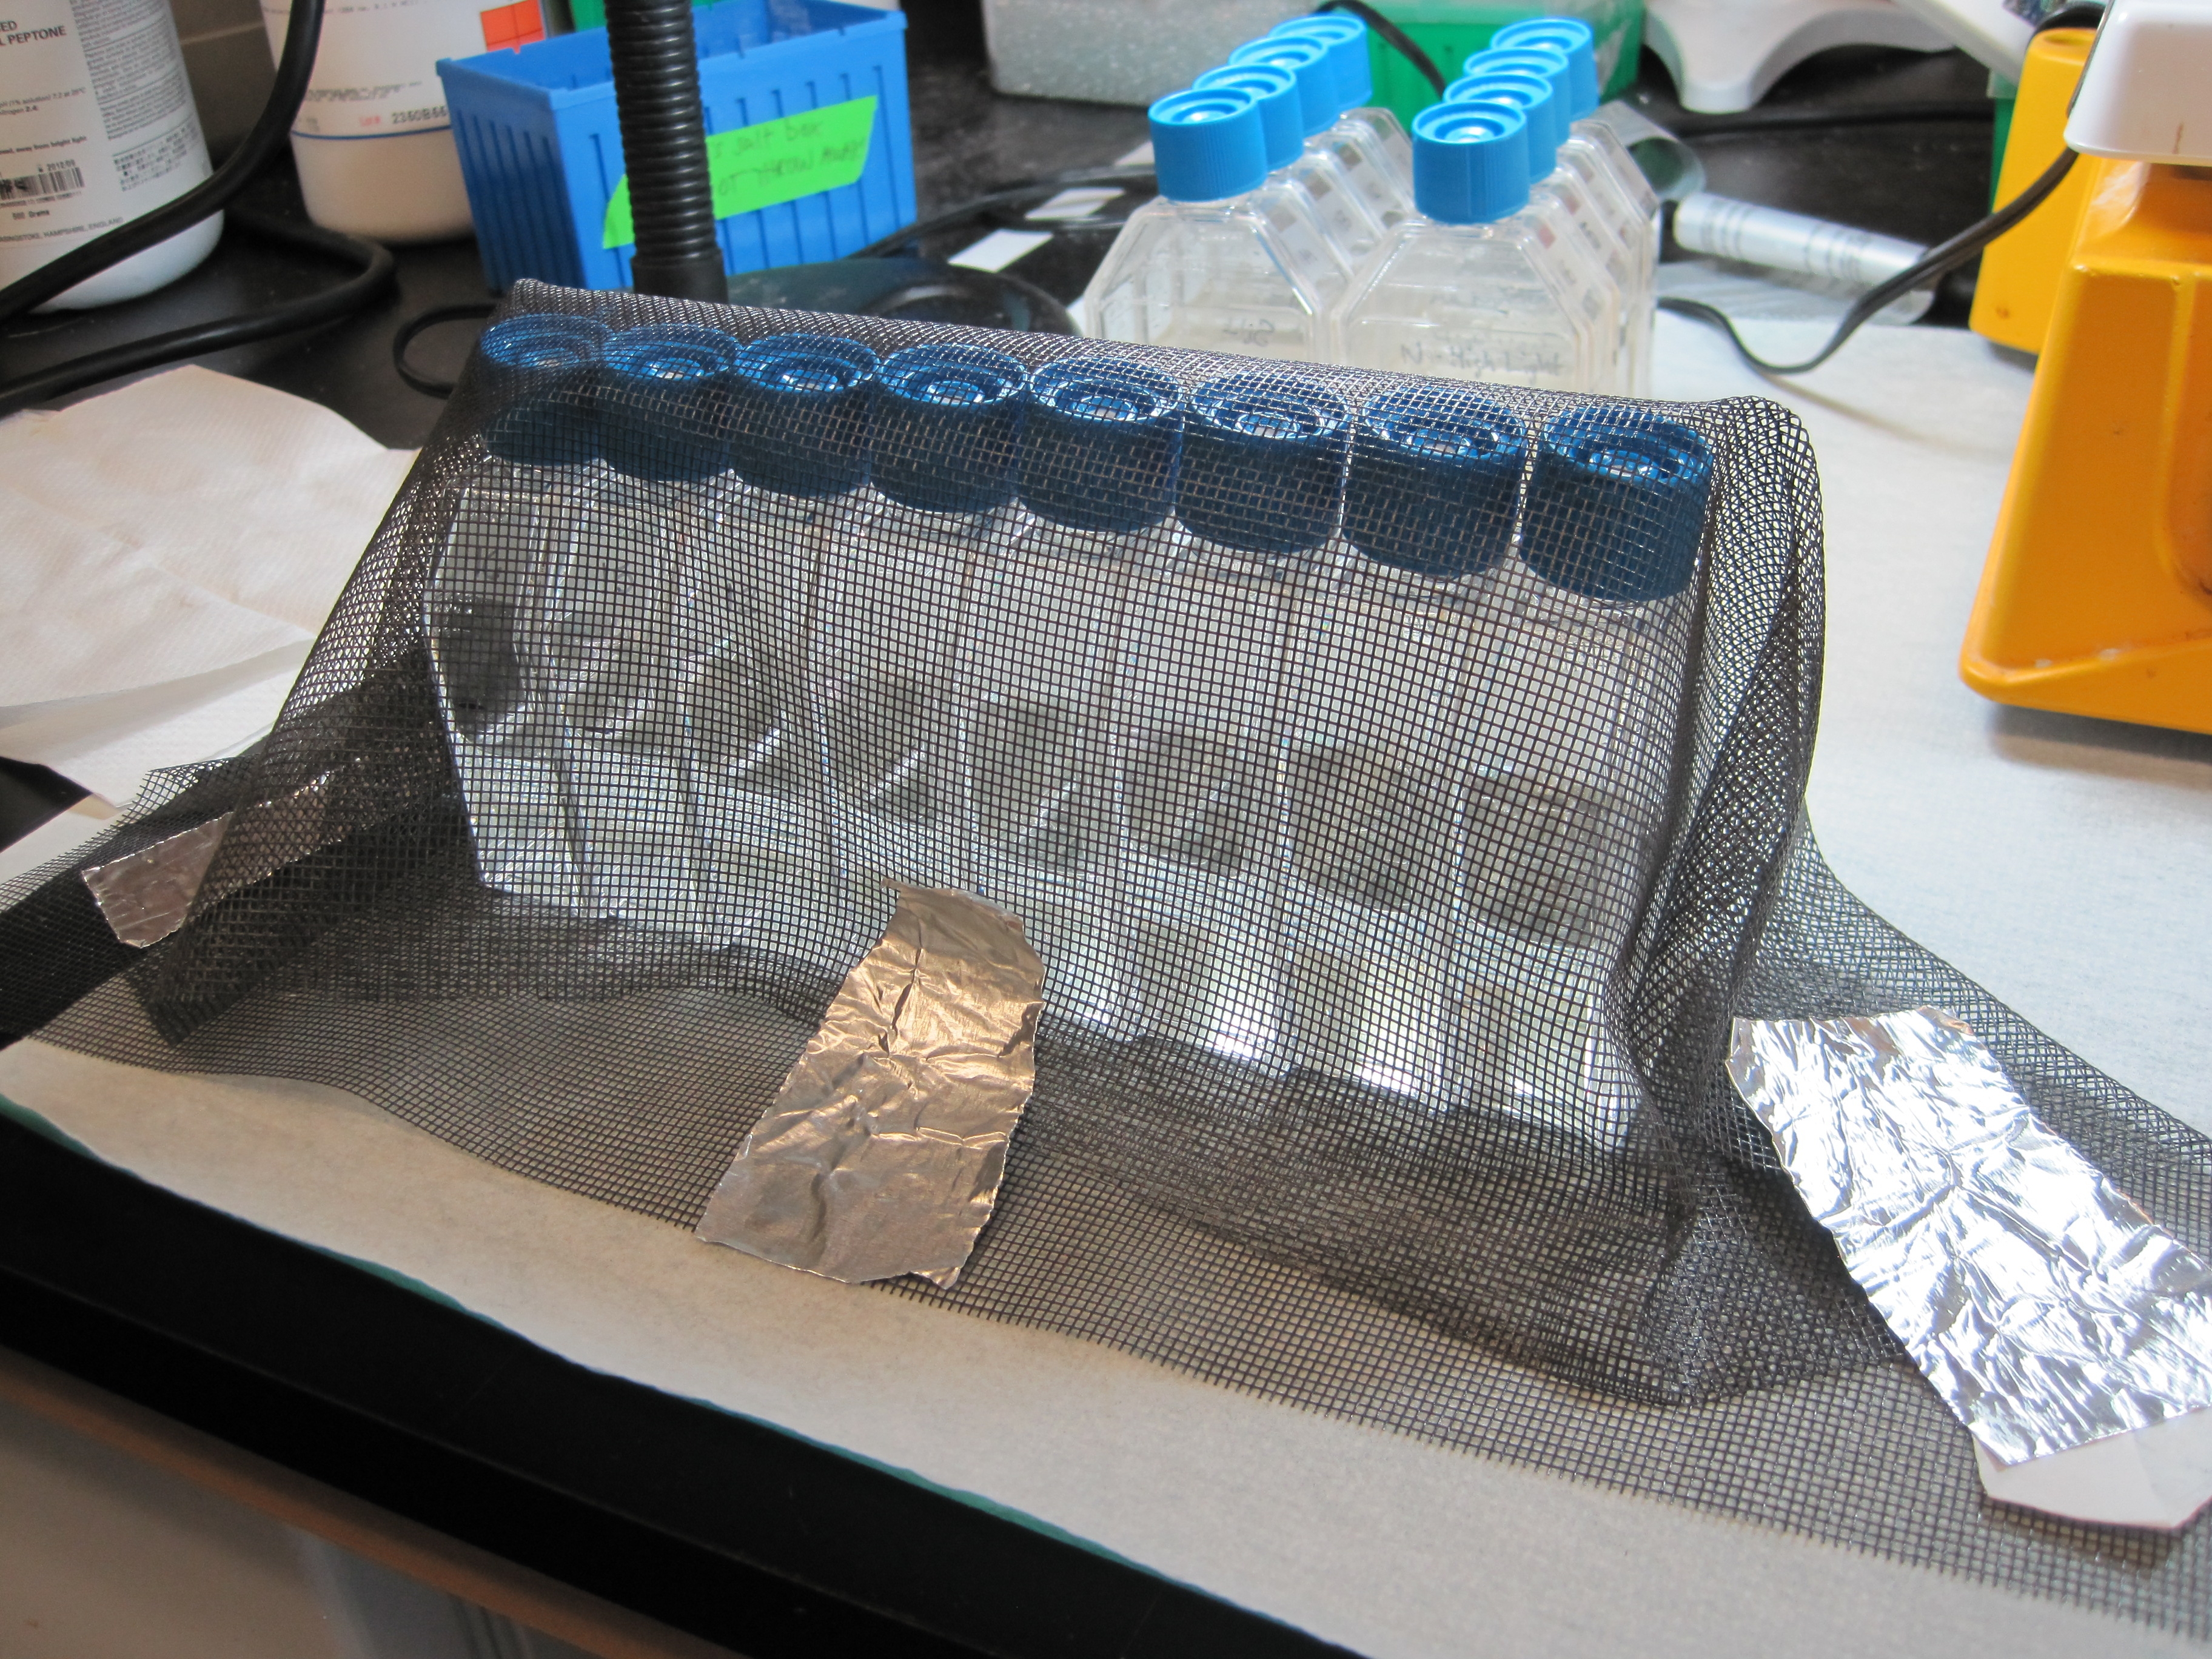
We also grew our diatoms with two different light amounts to imitate the amounts of light for winter and spring. The high light cultures were grown directly under a cool lamp, while the low light cultures were placed about 20cms from the light, and were then covered in mesh. Our lamps ran from 8am to 8pm daily. We also had one larger flask on a stir plate to mimic the affect of oceanic mixing and upwelling nutrients on algae growth.
Pouring Media:
- Label sixteen 70 mL canted neck flasks with breathable membrane as listed below:
- All Nutrients, High Light (flasks 1 and 2)
- All Nutrients, Low Light (flasks 3 and 4)
- N-, High Light (flasks 5 and 6)
- N-, Low Light (flasks 7 and 8)
- P-, High Light (flasks 9 and 10)
- P-, Low Light (flasks 11 and 12)
- Si-, High Light (flasks 13 and 14)
- Si-, Low Light (flasks 15 and 16)
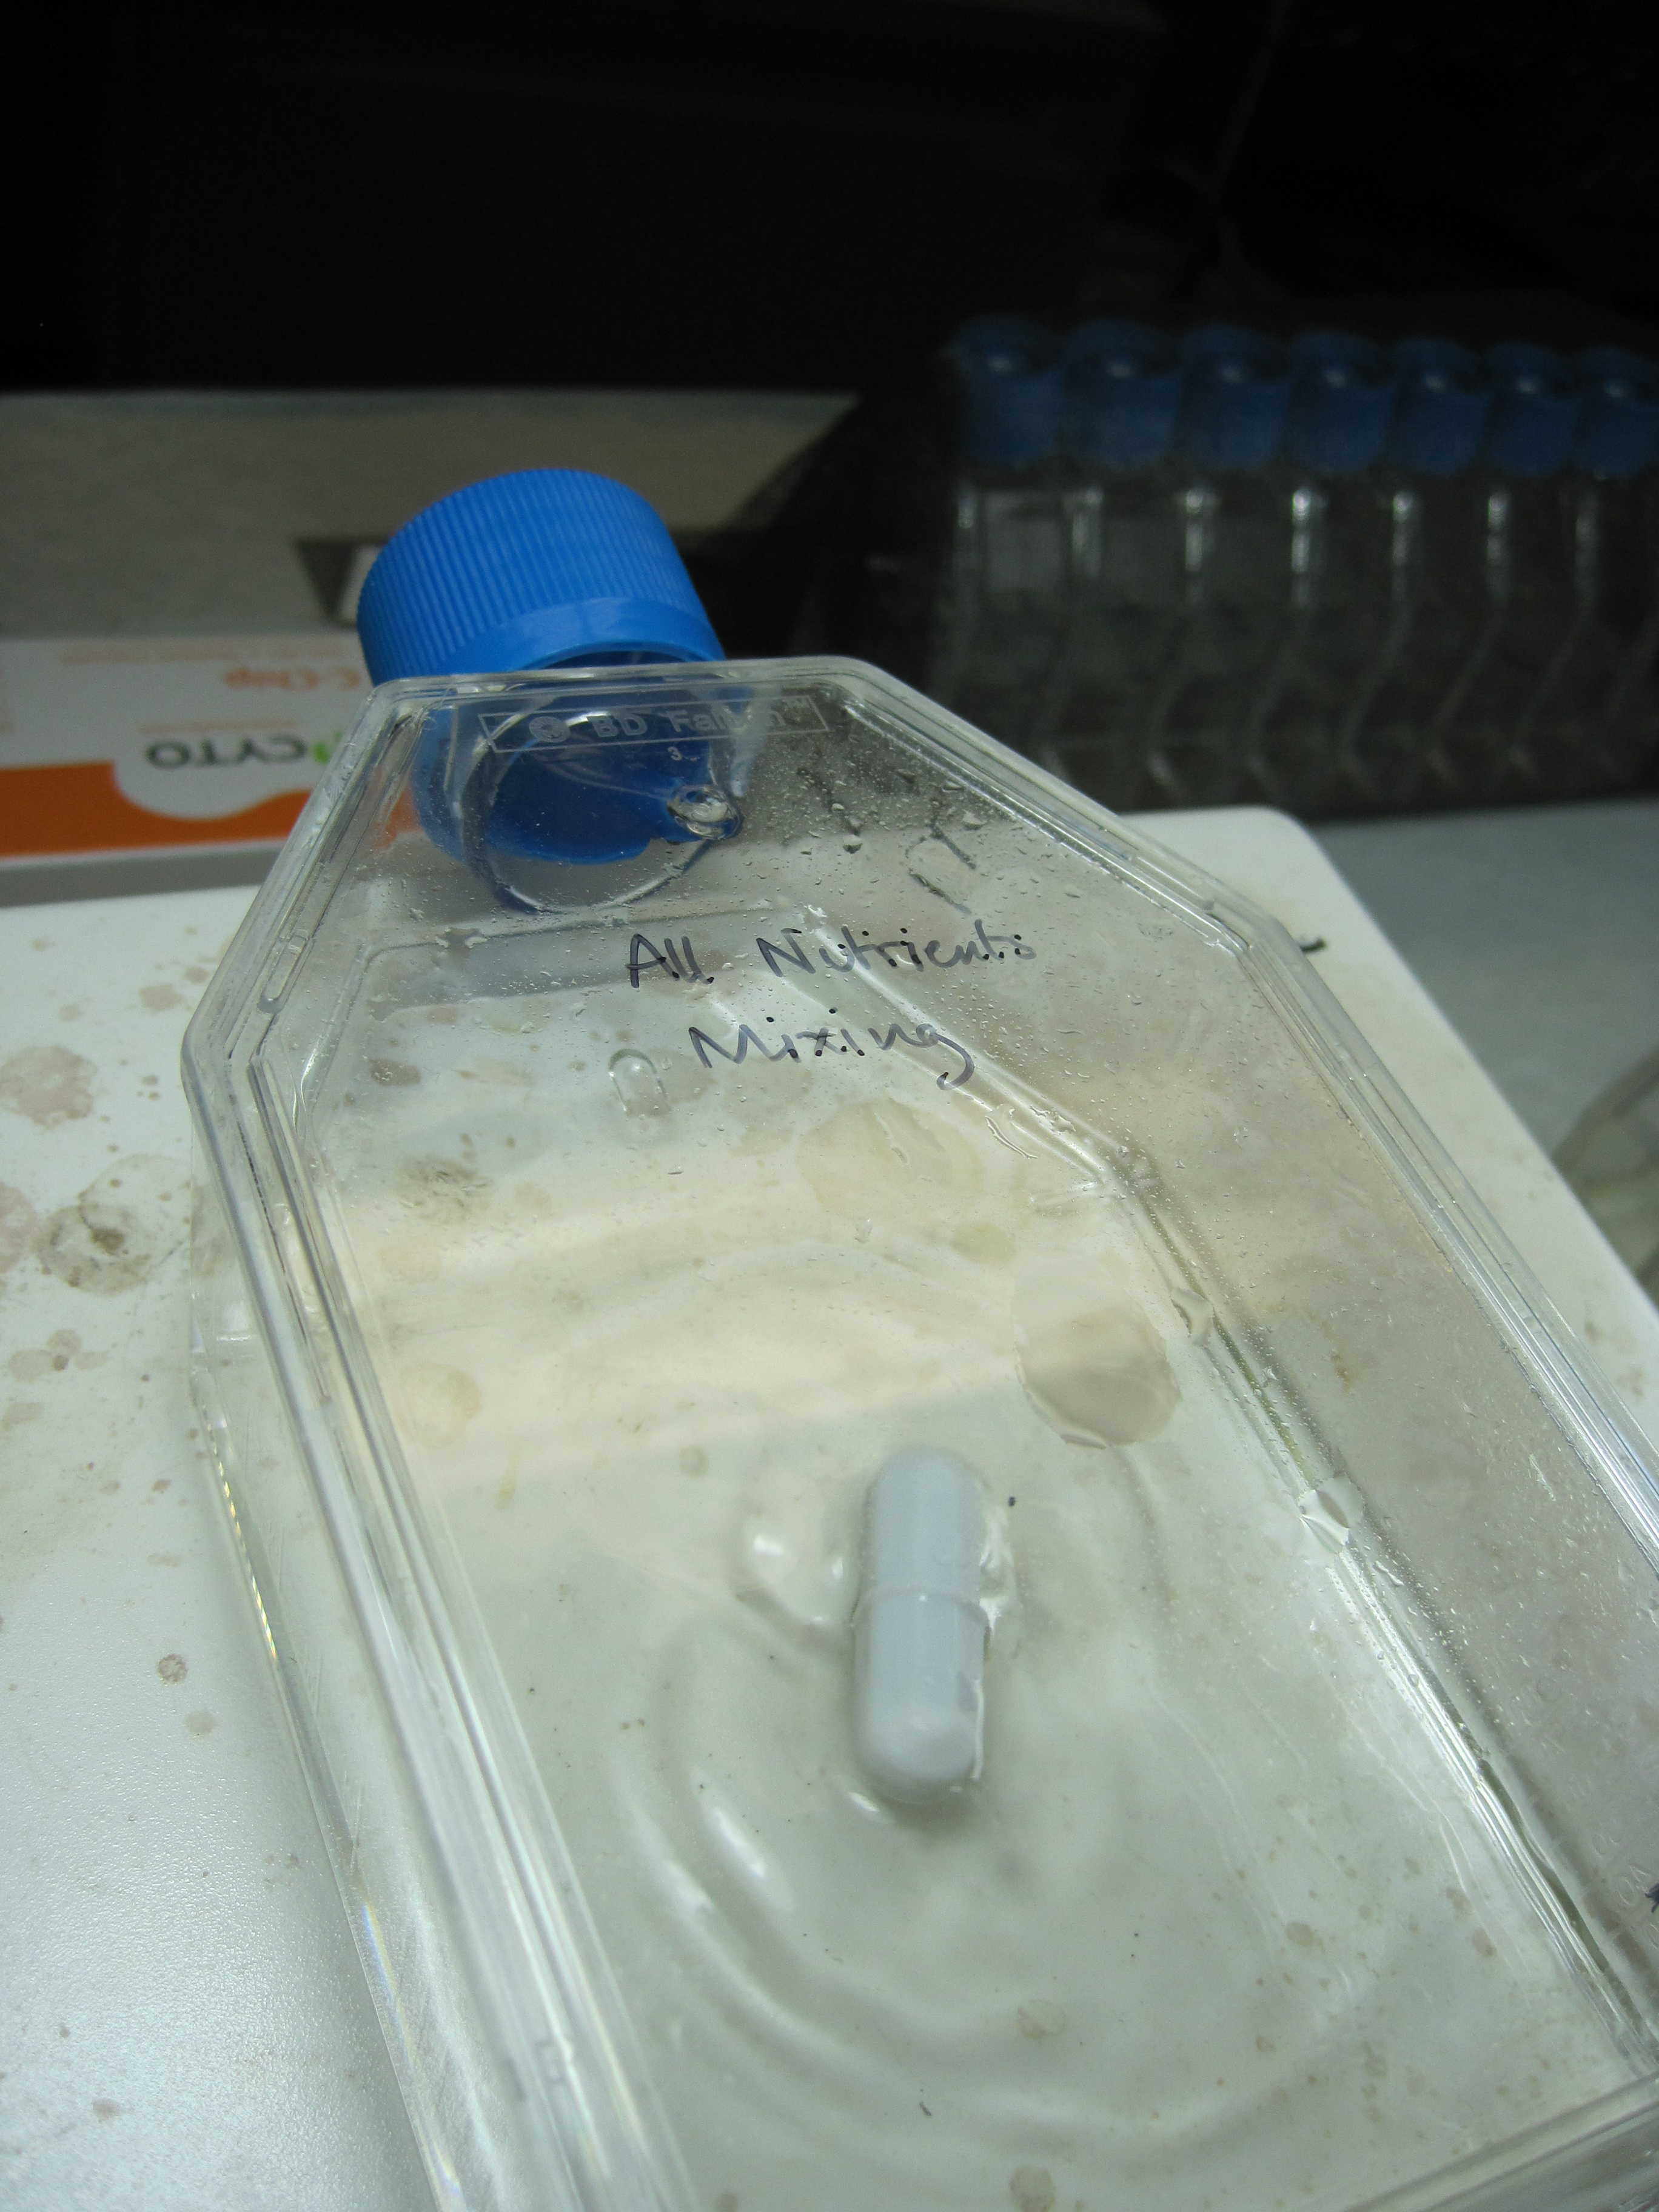
Label one 250 mL canted neck flask as “All Nutrients, Mixing.” Call this flask 17.
- Wipe down your bench with ethanol. Once your bench is completely dry, use a Bunsen burner and a striker to light a flame. Working near a flame will minimize the risk of bacterial contamination.
- Into flasks 5-8, pour 40 mL of the media labeled “N-.” Into flasks 9-12, pour 40 mL of the media labeled “P-.” Into flasks 13-16, pour 40 mL of the media labeled “Si-.” Into flask 17, pour 40 mL of the media labeled “All Nutrients”
Inoculating Cultures:
- Locate the flask entitled “stock culture.” Working near the flame, pour about 40 mL of this culture into a clean falcon tube.
- Pipette 1.5 mL of stock from the falcon tube into each one of your 17 flasks. Drop small stir bar into flask 17.
- Stand up all the flasks labeled “High Light” directly under the lamps set up along the windows (with the top of the flasks approximately 5 inches below the edge of the lamp). Place all flasks labeled “Low Light” ten inches further from the lights than the high light cultures, and cover them with one layer of mesh. Use tape to make sure the mesh covers all sides of the flask.
- Place flask 17 on its side on top of a stir plate. Turn on stir plate to the lowest setting.
Taking Your First Measurement:
Because you just inoculated your cultures, they should all have the same cell density. Therefore, you only need to take measurements from one culture today. These measurements will provide that starting values for all of your samples.
In order to avoid contamination, wipe down your bench with ethanol and, once your bench is completely dry, start a flame with your Bunsen burner. Pour about 2 mL of your culture into a clean test tube. You will take all of your samples from this test tube.
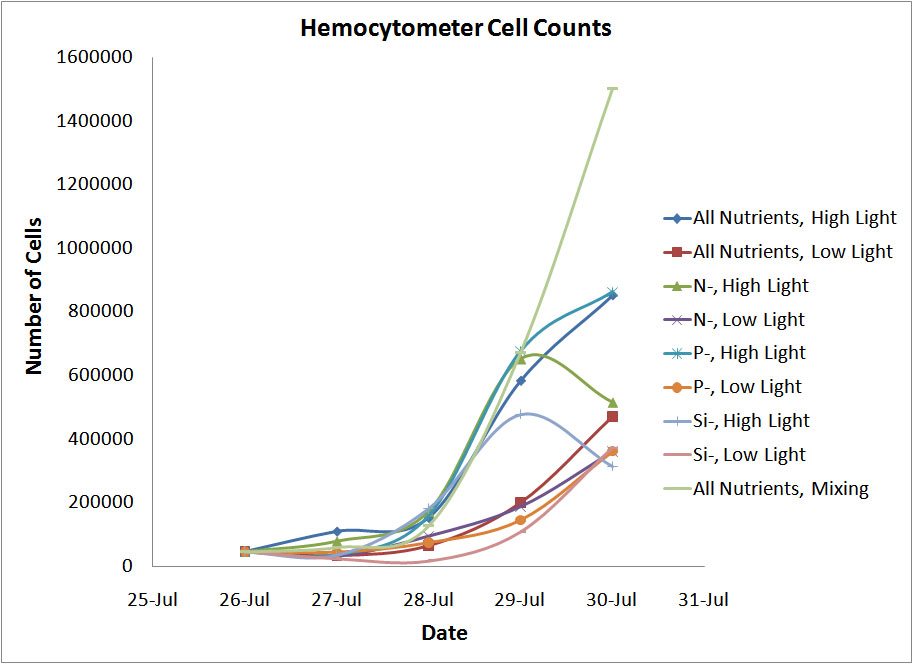
- Cell count using hemocytometer: A hemocytometer is a special microscope slide that has a grid on it. This grid allows you to count cells easily, and with a simple calculation, determine the density of your culture.
To use the plastic hemocytometer, load 10 μL of your culture onto the slide. When using the glass slide, use ethanol and a kimwipe to clean off both the slide as well as the slide cover, before you load your sample. Both the plastic and glass hemocytometers have two counting grids, meaning they can hold two samples at once. Place the slide under the microscope on 40x magnification and focus until you can see the hemocytometer grid.
Find the top right corner of the grid. Now, find the bottom left square (of the 16 small squares) within that corner. Using a clicker, count the number of cells in that square. Continue counting squares in the order indicated below, recording the total for each 16-square corner. You need to count at least 100 cells for your results to be significant.
Average the cell counts you recorded for the four corners. Each corner is 1mm by 1mm in size, and has a depth of 0.1 mm. Cell counts are usually recorded in cells/mL. Remember that 1 cm3 is equal to 1 mL. The volume of the area you counted cells for is 1mm x 1mm x 0.1mm = 0.1mm3. In order to convert to cells/mL do the following calculation:
(Average number of cells per corner) x (1000 mm3) = cells
0.1 mm3 (1 cm3) mL
Each time you finish counting with a plastic hemocytometer, throw it away. Each time you finish counting with the glass hemocytometer, clean it again carefully with ethanol and a kimwipe. Make sure to dry it well.
- OD600: Another way to determine cell density is to determine the optical density of your cultures at the wavelength equal to 600nm. Prepare your blank by putting 200 μL of your “All nutrients” media into an appropriately sized cuvette. Next, pipette 200 μL of your sample into a clean cuvette. Run blank and then sample in an OD reader. Record data taken. This first measurement will serve as the OD reading for all 16 of your cultures. Every other day, however, you will measure and record OD for each sample.
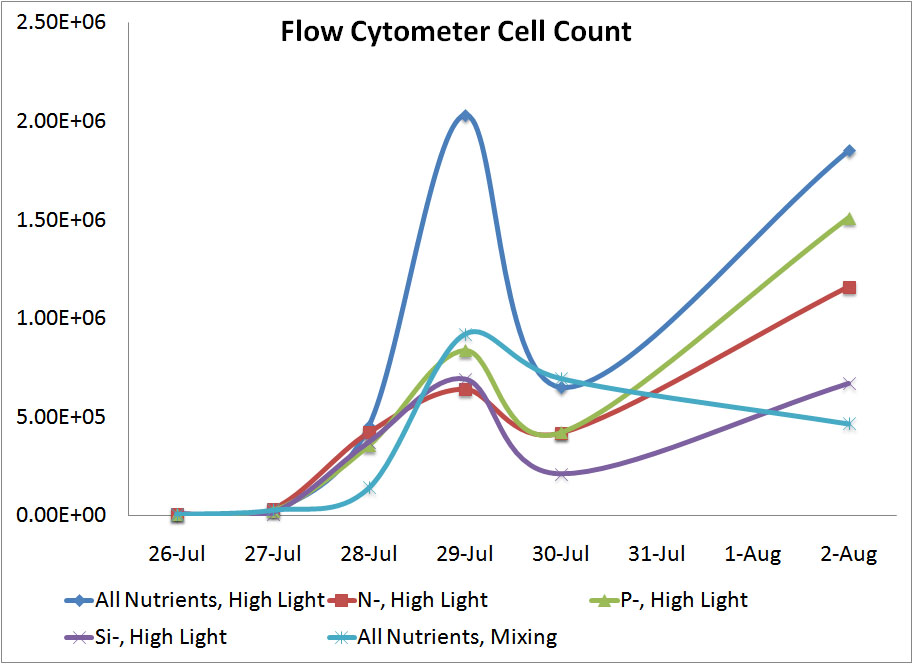
- Cell count using flow cytometry: Although this technology isn’t available in classrooms, we were able to accurately count our cells using an influx sorter. “Fix” the cells daily by pipetting 50 μL of 4% paraformaldehyde into 1 mL of our culture, and then inverting it to mix it. Then refrigerate all the samples until you run them all at the end of the week.
- Pigment Observation: Record the general color of the cultures, making sure to swirl them before observing because the cells will usually settle to the bottom of the flasks. Record the color of the homogeneous media.
Days 2-5:
Continue to collect all measurements outlined above, but on days 2-5 collected measurements for all 17 of your cultures. Work near a flame, making sure to pour out 2 mL from each of your cultures into clean, labeled test tubes to avoid contamination. Record and graph your results using Excel and then compare the different measurements you took.
(This procedure was designed by Alexis Valauri-Orton as a new module for the Baliga Education Program)
Setup
Results
Conclusion
One of the main goals of doing this lab was to see which forms of measurement were the most accurate and would be applicabel to a high school classroom. We found that the hemocytometer gave the most reasonable results of the three methods of coungting cells. Even though the flow cytometer was supposed to be the most precise way to count the cells, we likely didn't get a very good represenation of our diatom populations on either the 29th or the 30th and this led to skewed results. The OD reading weren't a very good way to measure the number of cells because diatoms reflect light in ways most other cells do not and this also skewed the results somewhat. The hemocytometer seemed to give very reasonable results for each sample.
In terms of the variables we tested, diatoms grew much better in high light than in low light. This was to be expected because algal blooms appear during the spring when the diatoms beign to recieve more light. The diatoms also grew better in full nutrient conditions. Depleting the nitrogen resulted in the greatest decrease in cell growth with the silicon depletion resulting in the second biggest change. Depleting the phosphorous had the smalles t impact on diatom growth. |