Spectrophotometer LabIntroductionA spectrophotometer is used to measure the concentration or population density of liquid samples. Although it is an invaluable tool for scientists in multiple disciplines, many schools cannot afford it in their science classrooms.
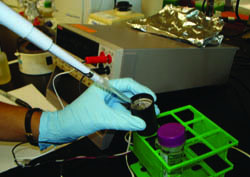
HypothesisThe values returned by the device being tested will relate linearly with the standard O.D. values of the halobacteria and the relative concentrations of the Hawaiian Punch standard, as per Beer’s Law. Procedure:Test 1 – Frequency vs. O.D.1. Prepare a 1 O.D. culture of Halobacteria. 2. Dilute by a tenth of the original until completely dilute (only C.M) so that there will be eleven samples with O.D. of approximately 1.0, 0.9, 0.8 ... 0.0. 3. Place 1 ml of the first sample into the device being tested and record all stable digits. 4. Take 100 µl of the sample in the device and takes its O.D. using the regular spectrophotometer. 5. Repeat steps 3,4 for all the samples. 6. Graph the numbers returned by the device being tested against the standard O.D. values. Test 2 – Frequency vs. Concentration of Hawaiian Punch 1. Dilute the stock Hawaiian Punch by a tenth of the original until completely dilute (distilled water) so that there will be eleven samples with concentration of 100%, 90%, 80% ... 0.0 stock Hawaiian Punch. 2. Place 1 ml of the first sample into the device being tested and record all stable digits. 3. Repeat step 2 for all the samples. 4. Graph the numbers returned by the device being tested against the concentration of Hawaiian Punch (% stock Hawaiian Punch) Results  ConclusionAs shown in the graphs, the Hawaiian Punch test displayed clearly the linear relationship as expected and resulted in a line of fit which closely correlated with the data. Using this graph, it is easy to map the frequency output of the device with percent concentration of Hawaiian Punch. However, the Halobacteria test resulted in noisy data, from which a clear relationship was difficult to discern. Although the data had clear direction it did not correlate well with the trend line. This could be a result of errors in preparation of the Halo cultures or in the spectrophotometer itself.
|
 To address this problem, a cheaper, smaller spectrophotometer was built in by the lab which returns frequency values that relate to concentration. The purpose of this investigation is to test and calibrate the spectrophotometer against O.D. values of halobacteria samples returned by the regular lab spectrophotometer and various dilutions of a standard sample of Hawaiian Punch.
 |
Any opinions, findings, and conclusions or recommendations expressed in this material are those of the author(s) and do not necessarily reflect the views of the National Science Foundation. Institute for Systems Biology, 1441 North 34th Street, Seattle, WA 98103-8904 |