Towards Developing a Multi-Omics Dashboard for MDS and AML
A NOTE FROM THE INTERNS:
Elaine and Mika would like to thank their mentor Dr. Guangrong Qin, Yue Zhang, and Luna Li for their unwavering support and guidance throughout this research project. In addition, they would like to express their gratitude to Claudia Ludwig, Faduma Hussein, and Sarah Clemente for their commitment to making this internship a meaningful and enriching experience. Moreover, they would like to thank the Thorrson-Shmulevich lab for their welcoming spirit and their cozy team-bondings – especially the riveting blueberry-picking adventures. Finally, they would like to thank their fellow interns for being the best lunch buddies and all-around amazing companions!


Project Summary
This summer, Elaine Jiang and Mika Tsubota, in collaboration with Anirudh Aravind and Isha Sudhir, interned with Dr. Guangrong Qin in the Thorrson-Shmulevich Lab. Their work contributed to the development of a multi-omics research dashboard for Myelodysplastic Syndrome (MDS) and Acute Myeloid Leukemia (AML), with the goal of making clinical and molecular datasets more accessible and insightful for the scientific community.
In the early stages of their internship, Elaine and Mika researched existing literature regarding MDS and collected a list of datasets in two categories: mutations related to age and longitudinal data of MDS to AML progression. After identifying a few promising datasets, they transitioned to analyzing the data for patterns that could be highlighted on the online dashboard.
Elaine’s Analyses
Elaine first employed a Wilcoxon-test on longitudinal MDS-to-AML progression data from a dataset found from the Blood Cancer Discovery Journal. She analyzed paired data points and visualized Variant Allele Frequencies (VAFs) across disease stages and found a statistically significant difference (p = 0.018) between VAF distributions in MDS versus AML.
Building on this, Elaine shifted focus to AML gene expression data. Using feature-selection techniques of Pearson correlation and Lasso regression, she identified the most predictive genes associated with age. The process in retrieving the top 20 correlated genes was with two approaches – LASSO regression and Pearson correlation– which gave her two sets of top 10 genes. What she found interesting is that one gene, LRRN3, appeared in both lists with the same direction of correlation. In other words, as patient age increases, expression of LRRN3 consistently decreases.
Then, she fed these selected genes into a Cox Proportional-Hazards model, which she used to explore survival outcomes, with age group (0-60 and 60+) included as a covariate. She found three genes with p-values<.05, but plans to conduct future steps to verify these results.
First, she plans to validate these findings in another cohort, such as TCGA-AML, to make sure these gene associations are consistent. Second, she wants to use a tool called the NCATS Translator, which can map biological pathways and show relationships between genes. That could help her understand why these age-related genes matter biologically.
Mika’s Analyses
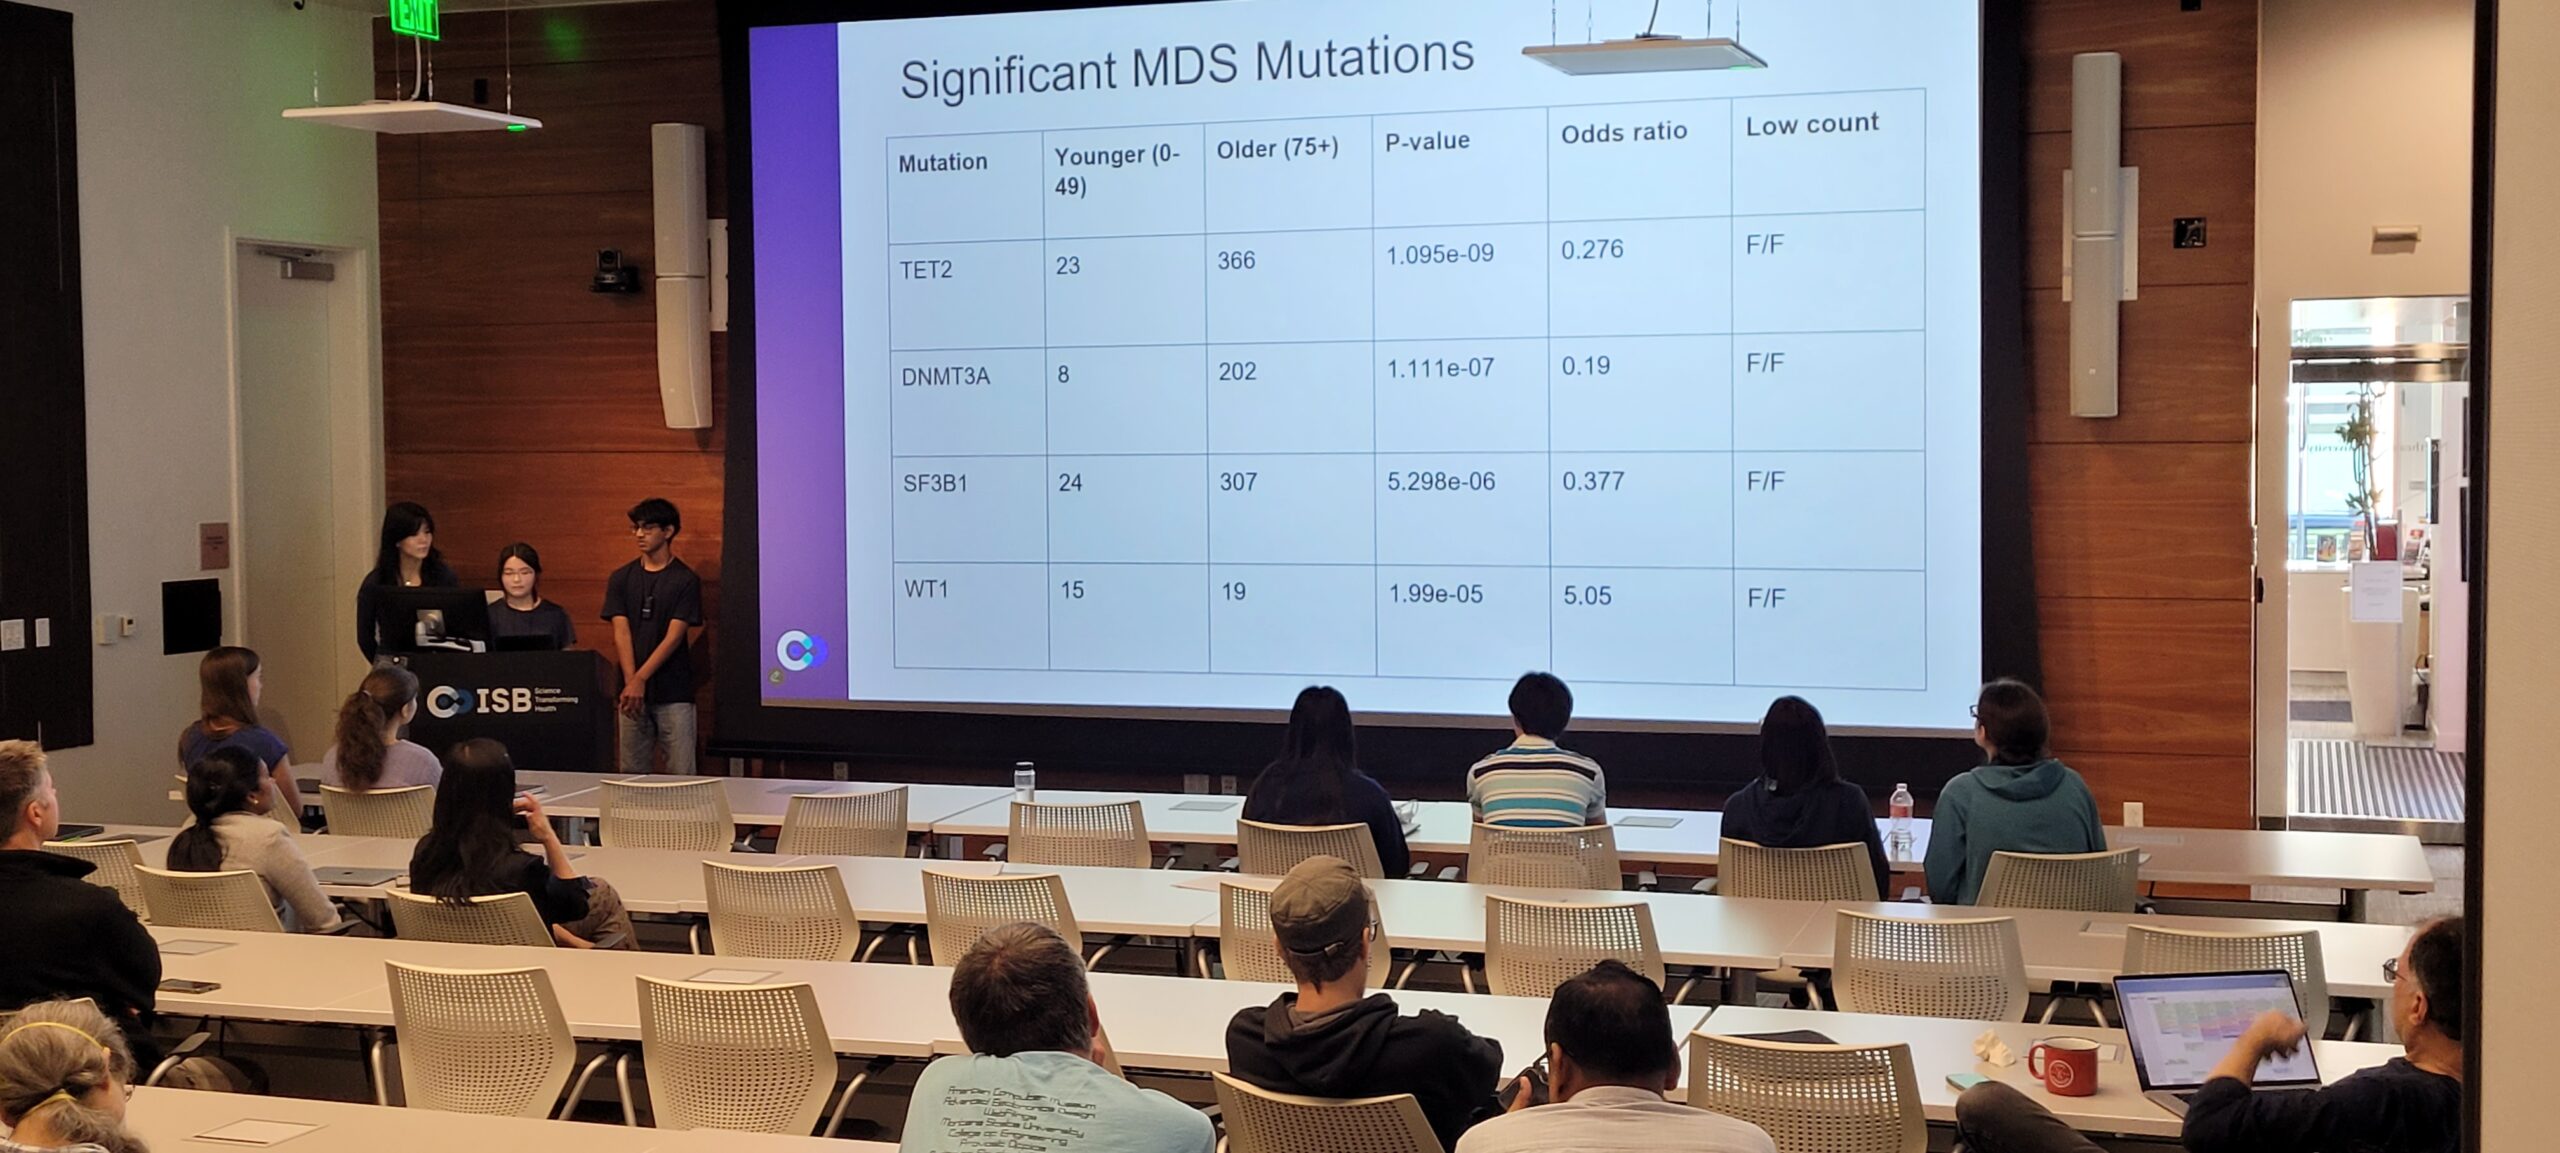
Meanwhile, Mika conducted a correlation analysis of age on MDS mutation frequency with clinical and mutational data from cBioPortal to identify age-specific trends and similarities to AML. Patients were grouped into younger (<50 years) and older (75+ years) cohorts, cutoffs based on references to literature. Mutation frequencies were visualized in heatmaps, which revealed clear age-associated trends: older patients showed a higher prevalence of spliceosome and epigenetic regulator mutations, while younger patients exhibited greater diversity in mutation profiles. Both MDS and AML showed enrichment in mutations such as TET2, ASXL1, RUNX1, TP53, DNMT3A, and SRSF2.
To evaluate the statistical significance of age-associated patterns, Mika applied Fisher’s Exact Test to recurrently mutated genes, which confirmed the trends observed in the heatmaps. She then developed survival prediction models to assess the prognostic value of these findings, using overall survival time and event Status from the cBioPortal datasets. The Cox proportional hazards model was applied to estimate the effect of age and mutations under the proportional hazards assumption, while random survival forests were applied to capture nonlinearities and complex relationships that the Cox model could not address. Two models were constructed: one predicting survival based on a patient’s age and full mutational profile, and another restricted to the subset mutations identified as significant by Fisher’s test. The former model achieved a concordance index (C-index) of 0.7, indicating moderate predictive power and demonstrating that age and mutational profiles carry meaningful survival information.
Isha’s Analyses
Isha’s work focuses on drug sensitivity, reconstructing numerical data from a drug sensitivity study in MDS and AML cases by extracting values from published heatmaps. A Sankey diagram was used to visualize patient-specific drug responses and identify the most effective therapies, while a drug class response analysis showed that HMA–Venetoclax combinations produced the strongest and most consistent effects. Next steps will integrate patient mutational profiles with drug treatment data to link mutation status to ex vivo drug sensitivity scores, with the goal of identifying predictive biomarkers of therapeutic response.
Integration and Dashboard
On the implementation side, their teammate Anirudh compiled these analyses into a comprehensive MDS dashboard using Django, a Python web development framework. The dashboard integrates mutation, gene expression, and survival data into an interactive platform, enabling exploration of results by age group, disease stage, or mutation set for both the public and researchers. This allows researchers to easily find relevant data and any needed information about the data sources. It also supports the addition of new datasets, making the resource expandable and encouraging future contributions from the research community. Furthermore, the dashboard incorporates tools from the Translator Component Toolkit (TCT) which was developed by Dr. Qin. It utilizes the Connection Finder which finds relationships between a disease and one or more biological entities, and the Path Finder which finds a pathway between two biological entities. Future additions to the dashboard could integrate machine learning models that could potentially aid in analyzing the datasets in the dashboard and providing valuable insights into MDS and AML progression and drug response.