Background:
Axial spondyloarthritis (axSpA) is a chronic autoimmune disorder characterized by joint and tissue inflammation in a patient’s spine. This leads to pain and discomfort, primarily in the lower back, limited mobility, and impaired ability to carry out daily tasks. If left untreated, axSpA can worsen over time, leading to fusion of joints, increasingly limited mobility, and a higher risk of developing comorbidities.
Currently, diagnosis relies on a combination of methods, including imaging, blood tests, physical examination, and genetic profiling. However, many of these criteria are nonspecific and not commonly tested for, making early diagnosis challenging. The advent of electronic health records (EHRs) provides an opportunity for healthcare providers to draw upon banks of comprehensive patient records spanning multiple years, if not decades. In this study, we used EHR data acquired from the National Institute of Health’s (NIH) AllofUs database, which contains EHR data for over 1.2 million patients across the United States.
Whole-genome sequencing (WGS) techniques are relatively recent, but greatly expand upon the available analyses that can be done with genetic data. With WGS, numerous aspects of a patient’s genetic makeup can be examined, including mutations, insertions, deletions, and other variants. We also aimed to incorporate WGS data in this project.
Research Goal:
The aim of this project was to improve early prediction of axSpA through the application of machine learning models to data from the NIH AllOfUs database. We worked to develop risk models to predict the occurrence of axSpA at the onset of primary symptoms such as back pain – (1) using only data that exists for most individuals, particularly in EHRs, and (2) using genomics data. We aimed to use markers that are commonly measured for a majority of patients – for example, CRP and ESR, two commonly-used diagnostic markers, are typically measured only if a clinician suspects inflammation, meaning most patients will not have a measurement present in their records. In this study, we combine clinical data with whole-genome sequencing to develop comprehensive risk modeling to identify potential novel indicative biomarkers, and to support clinical decision-making and potentially earlier diagnoses of axSpA.
Cohort:
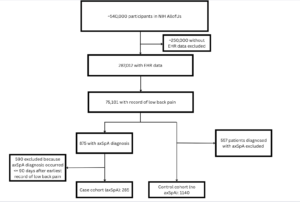
The inclusion criteria for the study required that all patients had documented low back pain or sacral pain in their electronic health record (EHR) at some point during their medical history. Patients also needed to have documented measurements of at least one of approximately 900 blood and urine biomarkers, at least 2 weeks prior to the first mention of pain. Our case group was comprised of patients who were then diagnosed with axSpA, and our control of patients who were not.
Data:
Blood and urine biomarkers: Blood and urine biomarker measurements recorded at least two weeks prior to the onset of low back/sacral pain was included for each patient. Biomarkers for which patients had multiple measurements over time were averaged, and those with high missingness (>60/70%) were excluded.
Condition history: Any pre-existing health conditions noted in a patient’s records were also included in the analysis. For this stage of the study, conditions were included if they fell into one of the following categories:
- Other autoimmune disorders (ex. multiple sclerosis, rheumatoid arthritis)
- Disorders known to be comorbid with axSpA (ex. uveitis, Crohn’s disease)
- Commonly acquired illnesses (ex. influenza, pneumonia)
- Cardiovascular conditions
- Hypertensive disorders
Survey responses: In the AllofUs database, patient responses to survey questions are recorded. For this analysis, responses to survey questions that fell into the following categories were included:
History of substance use (smoking, alcohol, e-smoking products)
- Experiences in healthcare settings
- Ex. “How often are you treated with less respect than other people when you go to a doctor’s office or other healthcare provider?”
- Self-reported ratings of mental health, physical health, and autonomy
- Family history of conditions (heart/bowel/autoimmune disease, etc.)
Cohort Flow Diagram:
Methods – Risk Modeling:
Classification
For the initial phase of risk modeling, a classification approach was employed to differentiate between case and control patients. The model used blood and urine biomarker data filtered according to the completeness at various thresholds as mentioned above. The classifier of choice was XGBoost, chosen for four primary reasons:
- XGBoost is highly effective when working with tabular data.
- Second, XGBoost has the ability to handle missing values directly. In this study, missing values were represented as NaNs, and XGBoost’s capacity to process these NaNs without requiring imputation was a significant advantage.
- Additionally, XGBoost is robust in handling multicollinearity, which was a key concern in this dataset. Given that some features in the dataset often represented similar physiological measurements but had been obtained using different techniques or reported in different units, multicollinearity between some features was expected.
Class weights and decision threshold tuning were both employed.
For our risk model, we chose a Cox Proportional-Hazards model. The CoxPH model estimates the effect of different variables (covariates) on the risk of an event occurring (in this case, being diagnosed with axial spondyloarthritis). We fit both models on blood and urine biomarkers, patient condition history, and responses to survey data.
Methods – Whole Genome Sequencing
The genomics analysis was designed to align with the case and control cohorts used for the EHR data analysis. However, as a result of high costs in NIH All of Us for extracting whole genome sequencing data, it was not feasible to include all 4,000 control patients in the genomics analysis. As a result of the refined criteria, along with the additional requirement for short-read whole genome sequencing data, the genomics case cohort consisted of 128 patients, while the control cohort was reduced to 579 patients.
For the current phase of the study, the analysis was focused exclusively on the gene ERAP1 as a result of its established relationship with AS. This gene was selected as a starting point because of its known association with the disease, but additional genes will be incorporated.
Genomics Data Encoding and Processing
Base Pair Selection: The analysis concentrated on a sequence of base pairs present in the gene ERAP1 that were also included in the VCF data. For each patient, 1,528 base pairs within this gene were utilized for analysis.
Global Allele Mapping: Each base pair was associated with a global allele list, which represents all known alleles for a given base pair within the dataset.
Categorical Encoding: For each patient, each base pair was encoded categorically according to their mapping to the global allele list. This encoding process involved translating each base pair’s genetic variation into a categorical format based on the alleles present in the global dataset.
Patient Cohort: The analysis included data from 705 patients, with 1,528 base pairs included for each patient.
XGBoost was employed for classification between case and control patients, for the same reasons was it was used with EHR data. Class weights and decision threshold tuning were both used.
Methods – Causal Analysis
SHAP-Based Feature Selection
Features were evaluated for how often their SHAP value sign aligned with the true class label. This alignment, where positive SHAP values matched positive AS diagnoses and negatives matched non-AS, was used to assess feature importance by focusing on consistent contributions to correct predictions.
Derived Metrics for Feature Ranking:
- SHAP-AUC: Each feature’s SHAP sign was used in a “mini-model” to predict AS or non-AS. The AUC of these mini-models assessed each feature’s discriminative alignment.
- SHAP-Recall: Recall evaluated a feature’s ability to detect AS cases, prioritizing sensitivity by minimizing false negatives.
Recursive Feature Elimination Using SHAP Derived Metrics: Features were ranked by SHAP-AUC and SHAP-Recall. The least ranked features were iteratively removed, with models retrained on each new subset. This approach outperformed traditional Gini-based selection in improving performance.
Improved Performance with SHAP Rankings: SHAP-AUC emphasized discriminative capability, while SHAP-Recall enhanced sensitivity. Features ranked highly by these metrics contributed to both predictive power and sensitivity, optimizing model performance.
Preliminary Results
Time-to-event modeling (CoxPH):
Performance for the CoxPH model was measured using concordance index, or c-index, which determines the model’s ability to output risk scores that, relative to one another, align with the actual recorded time to event for patients in the cohort. For example, if Patient A had a longer time to event than Patient B, Patient A’s risk score should be smaller. A c-index of 1 indicates perfect performance. The model obtained a c-index of 0.76, indicating moderately high predictive power. The covariates with the most statistical significance (p < 0.05) are included below. The column exp(coef) corresponds to the hazard ratio.
Most statistically significant covariates (p <0.05), as identified by CoxPH model, with hazard ratios.
Classification
Binary Classification – EHR Model
Classification Performance
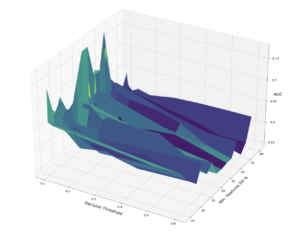
Performance of XGBoost Classifier on Validation Set at Various Decision Thresholds and Feature Completeness Thresholds
The best performing binary classification model achieved an AUC of 0.73, using only features that were not missing in at least 60% of the data.
Feature Importance
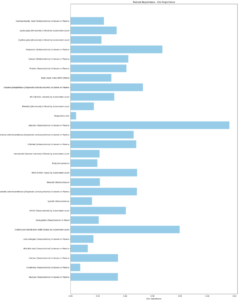
Gini Importances of Blood and Urine Markers in Best Performing XGBoost Model (60% completeness threshold; 0.73 AUC)
Feature Importance
SHAP Analysis – EHR Model
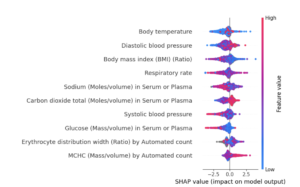
SHAP Summary Plot (only top features – not showing all features)
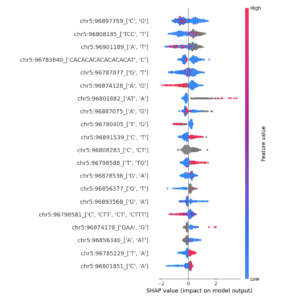
SHAP Analysis – Genomics Model
SHAP Summary Plot (only top features – not showing all features)
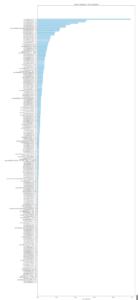
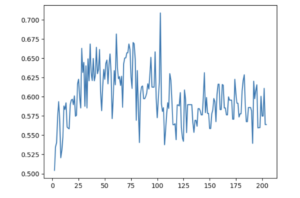
SHAP-AUC-Based Recursive Feature Elimination
AUC of Decision-Threshold-Optimized Binary Classifier at Various Numbers of Features Used – Using Recursive Feature Elimination Based on Individual Feature AUCs Assigned Using SHAP Values