
Understanding NLRP3’s Impact on the Onset of Type 1 Diabetes in Mice
Type 1 Diabetes is a chronic autoimmune disorder that prevents the pancreas from creating enough insulin, a hormone that helps regulate blood sugar levels. This leads to glucose building up in the bloodstream, leading to elevated blood sugar levels and heightening health complications.
The NLRP3 inflammasome is involved in the processes that contribute to beta cell damage in T1D. It is believed that NLRP3 deficiency (its removal) protects against/delays the onset of Type 1 Diabetes.
IPGTT Dataset: Glucose Tolerance Trajectories
We used an IPGTT (Intraperitoneal Glucose Tolerance Test) dataset to understand how glucose regulation varies across different mouse genotypes. First, we worked on cleaning and preparing this dataset for analysis. Using R, we visualized glucose trajectories over time, identifying key patterns in how different genotypes responded to glucose challenges.
We found that WT-WT (wild-type) mice consistently demonstrated the most efficient glucose clearance across all test weeks. In contrast, Het-NOD (heterozygous) mice started with higher glucose levels but exhibited a slower, steady reduction in glucose levels over time, indicating moderate glucose intolerance. The KO-NOD (knockout) mice showed the poorest glucose tolerance, with highly variable and elevated glucose levels over the duration of the tests. This analysis provided valuable insights into how specific genetic differences impact glucose metabolism, a key factor in the progression of Type 1 Diabetes.

Body Weight Analysis: Linear Mixed-Effects Modeling
For the body weight dataset, we implemented a linear mixed-effects model using the lmer function in R to account for repeated measurements within individual mice. This model allowed us to simultaneously analyze fixed effects (such as genotype, sex, and test week) and random effects (individual variability between mice).
We observed significant effects of genotype, sex, and test week on body weight. Notably, male mice consistently had higher body weights compared to females across all genotypes, and body weight increased as test weeks progressed, reflecting normal growth over time. A crucial interaction was found between genotype and test week—mice with the homozygous genotype showed a steeper increase in body weight over time compared to other genotypes. This suggested that, despite starting at a lower baseline weight, these mice experienced a more rapid growth rate. Additionally, there was no significant interaction between sex and test week, indicating that while males and females started at different weights, they gained weight at similar rates over time.

Blood Glucose Analysis: Linear Mixed-Effects Modeling
To further investigate how blood glucose levels were influenced by genotype, sex, and test week, we used a similar linear mixed-effects model.
Our analysis showed that while genotype did not significantly affect glucose levels, sex and test week were critical factors. Female mice consistently exhibited higher glucose levels compared to males, suggesting a sex-specific difference in glucose regulation. Over the test weeks, glucose levels generally increased, indicating the progression of diabetes in the mouse models. Additionally, we found that female mice had a steeper increase in glucose levels over time, suggesting a faster disease progression in females compared to males.

Survival Analysis: Time to Diabetes and Time to Death
One of our more advanced tasks involved building survival models to analyze the time to diabetes onset and time to death in the mouse models. This analysis was crucial for understanding how the disease progressed across different genotypes and sex groups. We used various probability distributions—Weibull, Lognormal, and Exponential models—to determine the best fit for our survival data. Additionally, we constructed Kaplan-Meier plots to visualize survival (time-to-death) probabilities over time.
We tested several criteria for diagnosing diabetes based on blood glucose readings. Mice with the homozygous genotype were found to reach diabetes significantly earlier than those with other genotypes, though this finding required further formal testing. Time to death was also influenced by genotype, with some genotypes showing a clear survival advantage over others. These analyses helped us better understand how genetic differences impact not only disease onset but also long-term survival.
Weibull


Lognormal


Time-to-Death: Kaplan-Meier

Model Comparison and Statistical Testing
For all the models we built, we employed the Likelihood Ratio Test (LRT) to compare different models and determine which best explained the data. We explored various model criteria, including the inclusion of fixed effects like sex and genotype and tested their interactions. By comparing the performance of Weibull, Lognormal, and Exponential models, we identified the most appropriate distribution for the survival analysis data as Weibull.
Troubleshooting:
In order to troubleshoot our linear mixed effects regression models and survival models, we took an iterative approach to refine and improve their performance with prompt engineering. With each iteration, we focused on adjusting the model parameters, reevaluating our choice of variables, and refining assumptions to better match the underlying patterns in the data. By using prompt engineering techniques, we were able to identify where the models were falling short. This allowed us to improve the models’ overall accuracy and performance.
Learning:
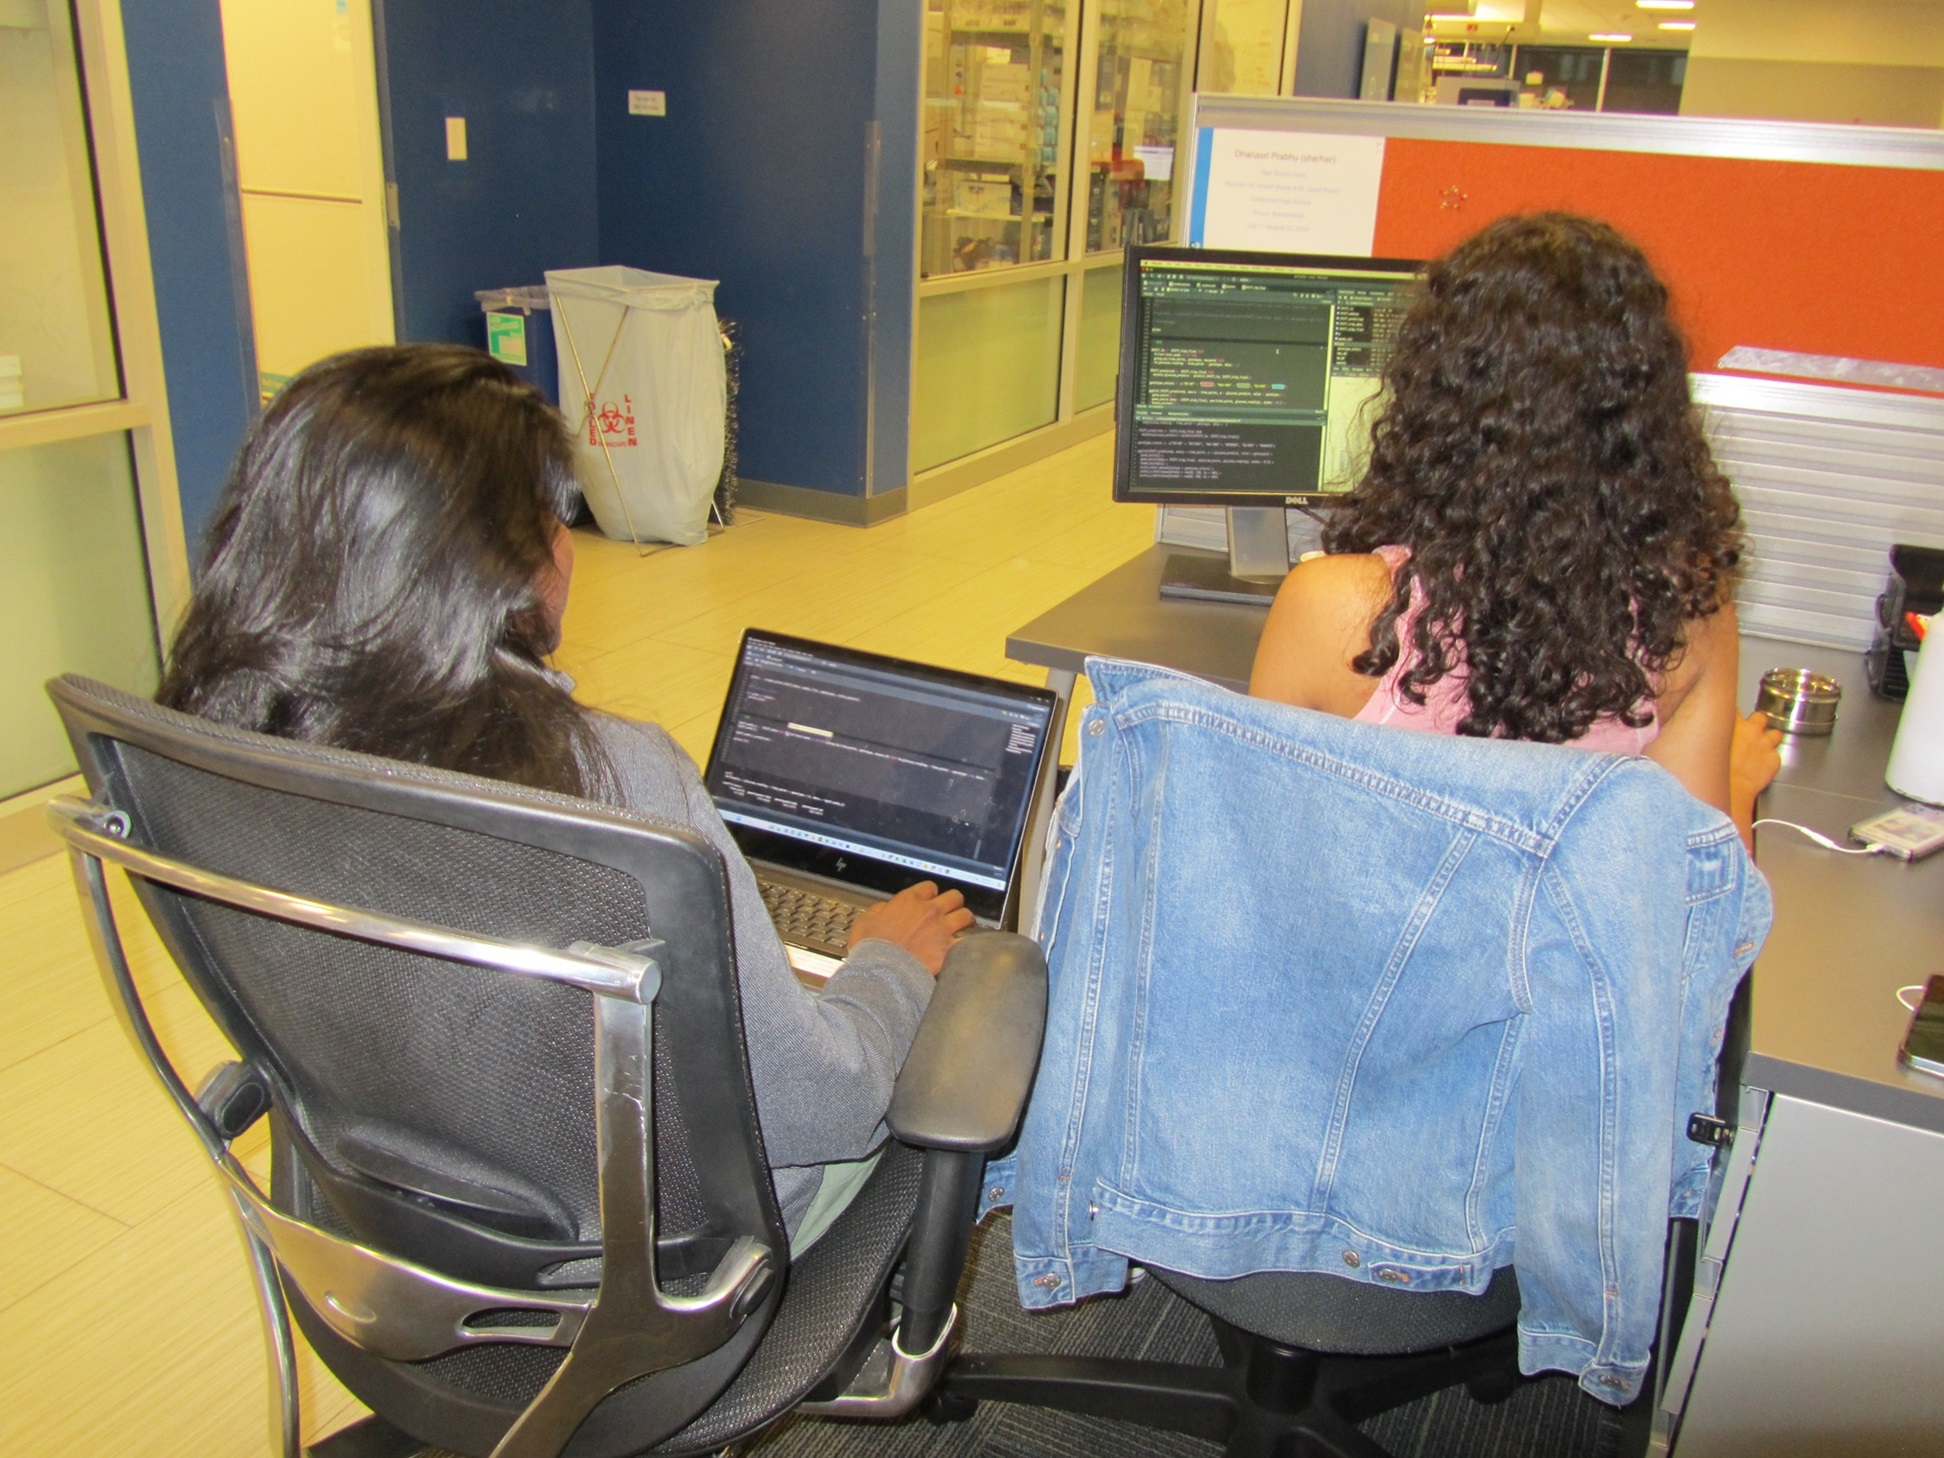
Aiming to instill a foundational understanding of data analysis and visualization, we began by strengthening our skills in the programming language R. We took programming lessons through the coding site DataCamp. Building our skills through various courses from “Intermediate R” to “Hierarchical and Mixed Effects Models”. We were also tasked with improving our knowledge of varied topics with relation to our project. Such as, experimental design, chart design, R packages, and more. Our usual daily assignments would consist of 1 DataCamp course, 1 theory task, and 1 coding task. The coding task being either the next step in our project, or a challenge given by our mentor. At the end of the day we would regroup for our mentor to review our progress and our code. Following this path aided us in learning and benefitting from our internship.
A Note from the Interns
We would like to acknowledge our mentors Ameek Bhalla and Jared Roach for guiding us through the broad intersection of immunology and data analytics. In addition, thank you Greg Lampel, Srushti Vyas, and the Subramanian Lab for supplying us with the resources that were instrumental in the development of our project.
Thank you Claudia Ludwig and Sarah Clemente for recognizing our potential and providing us with this incredible opportunity. We will always cherish the kindness and support we’ve received from you.
And last but not least, thank you to Bruno Balogh; our insightful conversations about chocolates, languages, and apples will not be forgotten.