![]()
Systems Education Experiences Website: https://see.isbscience.org
"The Baliga group devotes a substantial portion of their time to working with Seattle-area high schools. Since 2003, we have been steadily working with teachers and students to help transfer STEM concepts and proficiencies from the lab to the classroom."
The Systems Education Experiences (SEE) program provides an integrative approach to help all participants internalize systems biology methods and thinking.
Our Vision is for all students to be engaged in using systems-level, scientific thinking to better understand and participate in solving today’s complex problems. Our Mission is, therefore, to cultivate cross-disciplinary skills for solving complex problems.
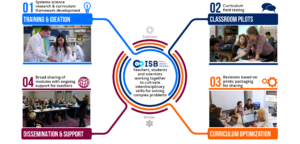
We do this through an iterative program that begins with a cross-disciplinary summer internship. Teachers and students (high school through graduate) work with STEM* scientists during the summer to learn how systems science is applied to better understand and solve today’s complex problems.
The team assesses what is currently available for schools and begins to build needed curriculum, frameworks, and technology based on what they learned in the lab. All curriculum is aimed at helping students develop the thinking and concepts required for using systems science to solve complex problems. This is possible in traditional non-integrated courses by presenting a problem or phenomenon that inherently brings together biology, chemistry, physics, engineering, mathematics, statistics, and computer science.
During the academic year, these curricular ideas and frameworks are field tested in classrooms (generally in 8-12th grades). If that work is pertinent, a new summer team comes together to further develop that curriculum module while connecting more completely to best education practices, standards, and the systems level work being completed in the lab. Field testing, modification, and optimization occur over three years. If hands-on cultures and lab materials are needed to enable easy classroom implementation, then a kit of materials is designed and made available.
All curricular materials, online tools, and teaching aides are placed on our website for broad dissemination. The curriculum generally focuses on the new systems process of science. Because this is often a paradigm shift for educators, the SEE team attends and hosts professional development institutes to train teachers to bring this curriculum and these hands-on STEM experiences to their students. New ideas come from teachers at those institutes and the cycle begins again!
*STEM = Science, technology, engineering, and math
This work is made possible by National Science Foundation and National Institutes of Health.
One of the key objectives of ISB involves transferring knowledge gained through research to the community for the benefit of society. The Baliga Lab meets and surpasses that objective through an education program in which high school interns complete systems biology research and help develop hands on instructional modules for students to use as part of their science curriculum.
Each January, the Baliga Lab posts a job opportunity on the ISB careers website, enabling high school juniors to apply for a competitive, paid summer internship. This internship is very different than those typically found in research labs. The systems biology approach allows students to work with many specialists, directly involving the students in a variety of projects, using many types of technology and techniques. Students gain valuable microbiology, engineering, and computational experience. Due to the unique nature of this curriculum building and laboratory experience, students are highly engaged in creative problem solving as well as both independent and group learning. The internships are focused on bringing these key opportunities to students who typically would not have access to a professional work environment and a state-of-the-art research lab.
As part of Systems Education Experiences, we offer many opportunities for professional development for high school teachers.
Formal Courses – Each summer we host a week long Systems Science Academy for Teachers.
Summer Teacher Internships – During the summer we host paid teacher internships for learning about systems biology and translating this learning into curriculum modules.
Professional Development through Conferences – We present at multiple conferences throughout the year.
Direct Training at Schools – We travel to train teachers at their school districts.
Webinars – We participate in webinars to train teachers remotely.
Partnering with Others – We also partner with many organizations to optimize training experiences and to help as many teachers as possible.